Will History Repeat?
This chart takes us back 80 plus years to see when we did this before. I’m looking at us today being where we were in 1927. That translates into another 2+ years of a bull market in stocks, which does not bode well for gold. 2008 is 1920, 2018 is 1929. The economy is very different today than it was back then, so one cannot really compare apples to apples. But cycles are cycles, and I think we are close to another peak, sometime in the next couple of years. Note that a businessman was elected president in 1928, and the Republicans owned both houses of Congress. History repeats.
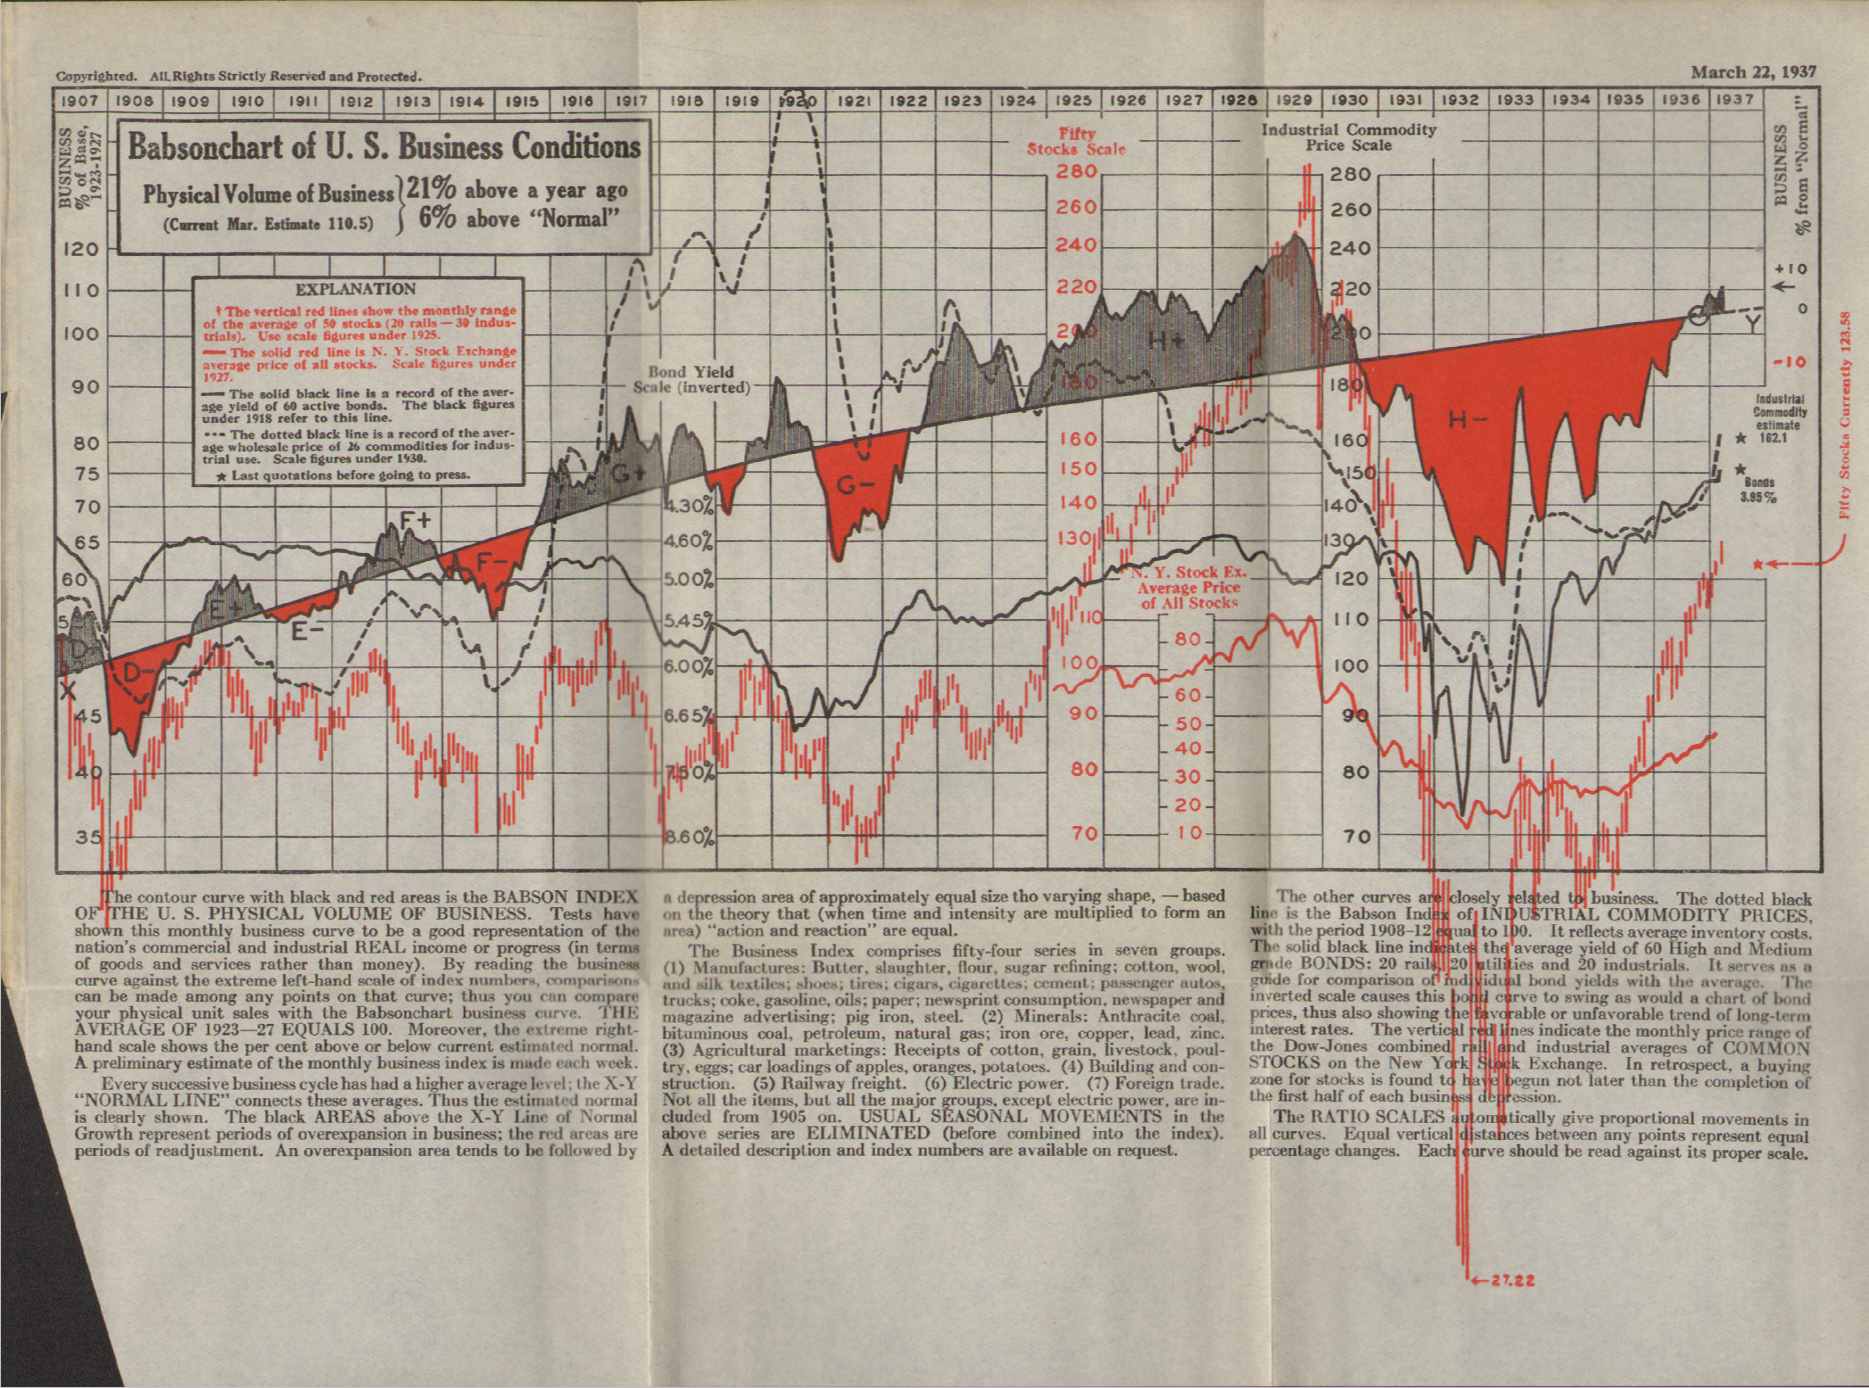
Babson was an interesting dude. Nice chart.
That is an interesting analogy Avocado. Worth pondering.