USD long term
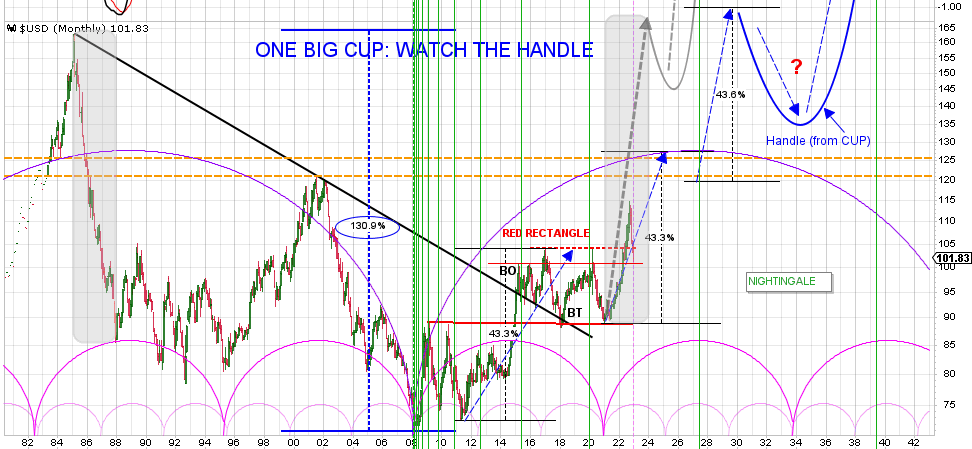
Here reminder of my formerly posted Long Term chart on USD (40 years). Nothing has been re-set in this chart except adding the LITTLE PINK CYCLES + a thin vertical dashed pink line as marker. The following makes me Think Hmmmm …
This month’s USD low @ 101.26 tagged potential Horizontal SUPPORT (HOR.SUP) within the RED RECTANGLE. where 104 was lost for potential support. Now @ 101 could prove to be Strong Support. Furthermore . . . Observe ALL charted cycles which to me are SUPERIOR. Now, look closer to the TOP of the Smallest Pink Cycle which more/less equals the last USD-TOP (oct/nov-2022); see the thin vertical dashed line. But this Little Cycle also set this Month’s USD (assumed) INTER-CYCLE-LOW. So after a run-up of the USD since January 2021. The run-up was strong due to Larger Cycles giving such additional energy. It marked a Little-Cycle Top (oct-22) followed by a possible intermediate-cycle low (jan-23). Probably this month and possibly even last week (!) and maybe even today (?) Is the USD intermediate LOW in? I think YES but still possibly could also be ‘off’ for 1-2 months as this chart is a Long Term Monthly chart. Maybe 1 more cent lower to mark the 100-Line but maybe last week’s 101 will just do it. Remember: ’round numbers’. USD just experienced a 2-3 month ‘cool-off’ eg. BT; that was all Folks. Next: intermediate PO for USD 118-128 (HOR.RES)!?
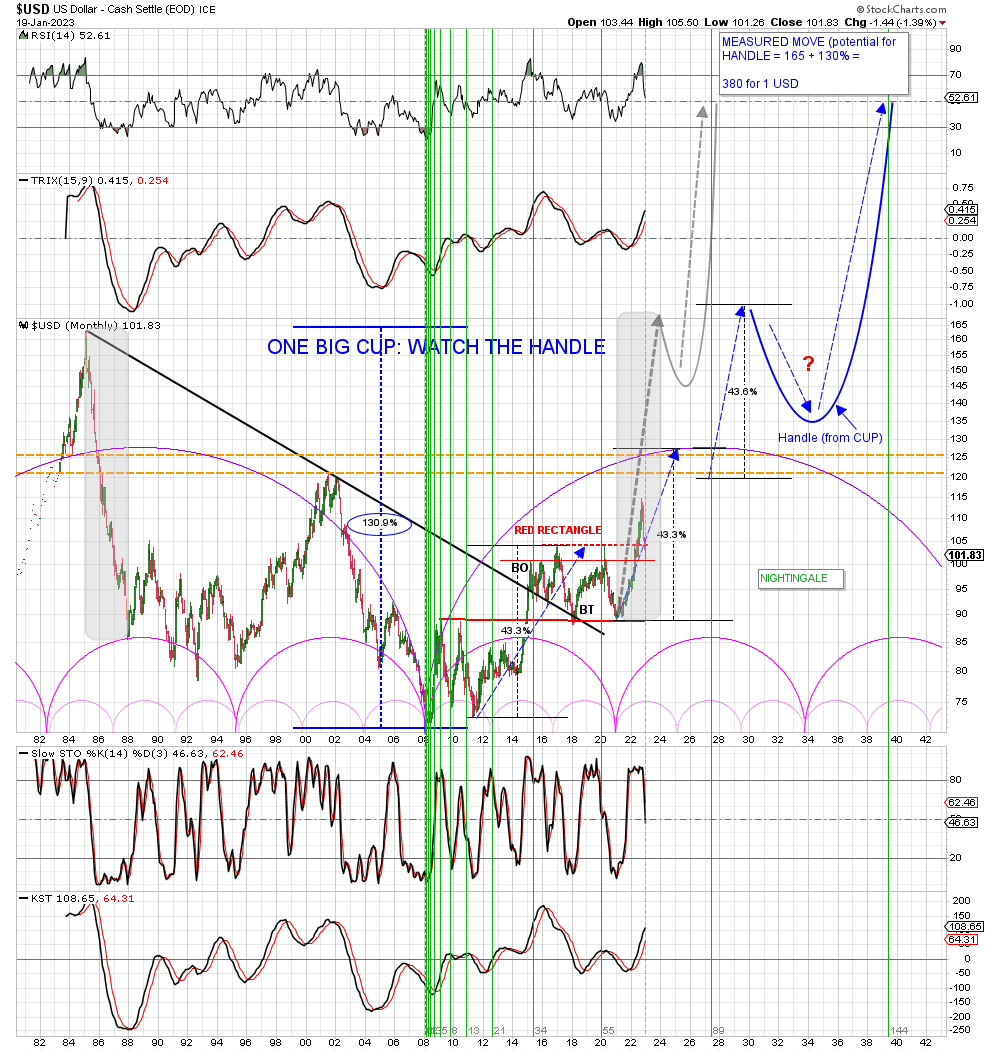
On the thumbnail chart, the few indicators still seem very healthy; no sign of weakness other than some indicator relief/BT.
See former post: CLICK HERE having a Price Objective (PO) of 380 while now @101. Interestingly 21/22 January a New cosmic planetary cycle begins. So next three trading days I consider INSTRUCTIVE going forward (possibly POWERFUL as from Monday). It all Adds UP. USD going HIGHER . . . more/less from here.
IMO. DYODD.
This chart is mainly a plot of the $US vs other Western currencies. As the Bric++ currencies gain strength and perhaps become backed by hard assets, the $US will not be as important and will lose purchasing power even though its index may be up.
The magician always makes you look at the wrong thing(s) … masters of illusion.
If the DXY chart was not manipulated, where would gold be now?
Note: Disclaimer: All markets are manipulated.
Need examples:
(i) https://fred.stlouisfed.org/series/PNGASEUUSDM
(ii) How about Crude Oil futures going to zero during Covid lockdown?
(iii) Bitcoin manipulation by Thiel (I’m not a crying loser, Sir Fully)
“The magician always makes you look at the wrong thing(s) … masters of illusion.” Great point about distraction which is why I have said many times the DXY is just that. It isn’t important except for when you are entering or exiting precious metals trades.(at that specific moment) Paying attention to it is a waste of time.PS: It isn’t going anywhere near it’s recent highs, with the possible exception we have nuclear war and if that is the case, who cares, we will all be dead.