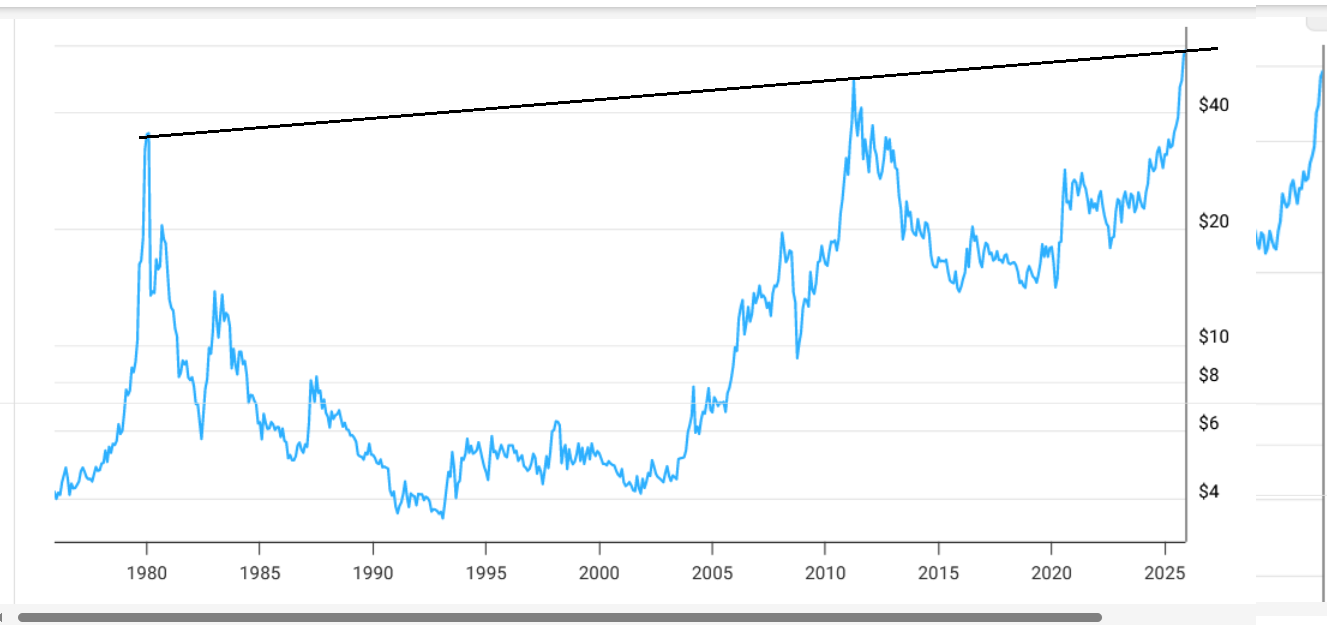
SILVER 50 YEAR CHART
Superlurker Chris just sent me this 50 year log chart
A simple statement
thanks Chris
I wish you sent this before yesterday when farmer convinced me to sell some of my stash 🙂
this has to be the biggest and most perfect cup and handle pattern in the history of Patterns
The Price Objective from the bottom of the cup thru the top is…um…ASTRONOMICAL
IF I POST IT IT WOULD MAKE EVEN PO BALONEY BLUSH
SHEESH
….. OK SCREW IT…LETS DO THE MATH ( note pedro nailed my math…here is the revision )
THE PRICE OBJECTIVE OF THE MASSIVE C&H WOULD DERIVED BE FROM ABOUT $4 ( BOTTOM OF THE CUP ) TO $40 ( TOP OF THE CUP MID POINT )
SO THAT IS A 900 % MOVE ( a log chart measures % moves )
WHAT IS AN 900 % MOVE UP FROM $40
3 …2…1
$400 AN OUNCE
“WHAT IS AN 800 % MOVE UP FROM $40 ?…. $40,000 AN OUNCE”
stick to teeth!
100% up from 40 is 80. =1×40 +40
800% = 8x up, = 320 + 40, or 360
SHEEESH … 🙂
OK OK
4 to 40 is a 900% move right ?
8 12 16 20 24 28 32 36 40 ( each $4 is 100$ of the original …right ?
and 40 to 4000 would be the right answer also a 900% move
check my math and I will revise this
try again. and follow MY example
AH…$400
IT WAS SO OBVIOUS
4 TO 40 IS THE SAME AS 40 TO 400
SHEESH !!!
Compelling chart. It screams the move has just begun. Just be sure to get out before a mega correction, wherever that is.