THE WHOLE BULL AND NOTHING BUT THE BULL
AN AMAZING CHART FROM THE WIZARD OF RAMBUS
THE NARRATIVE IS JUST AS AMAZING
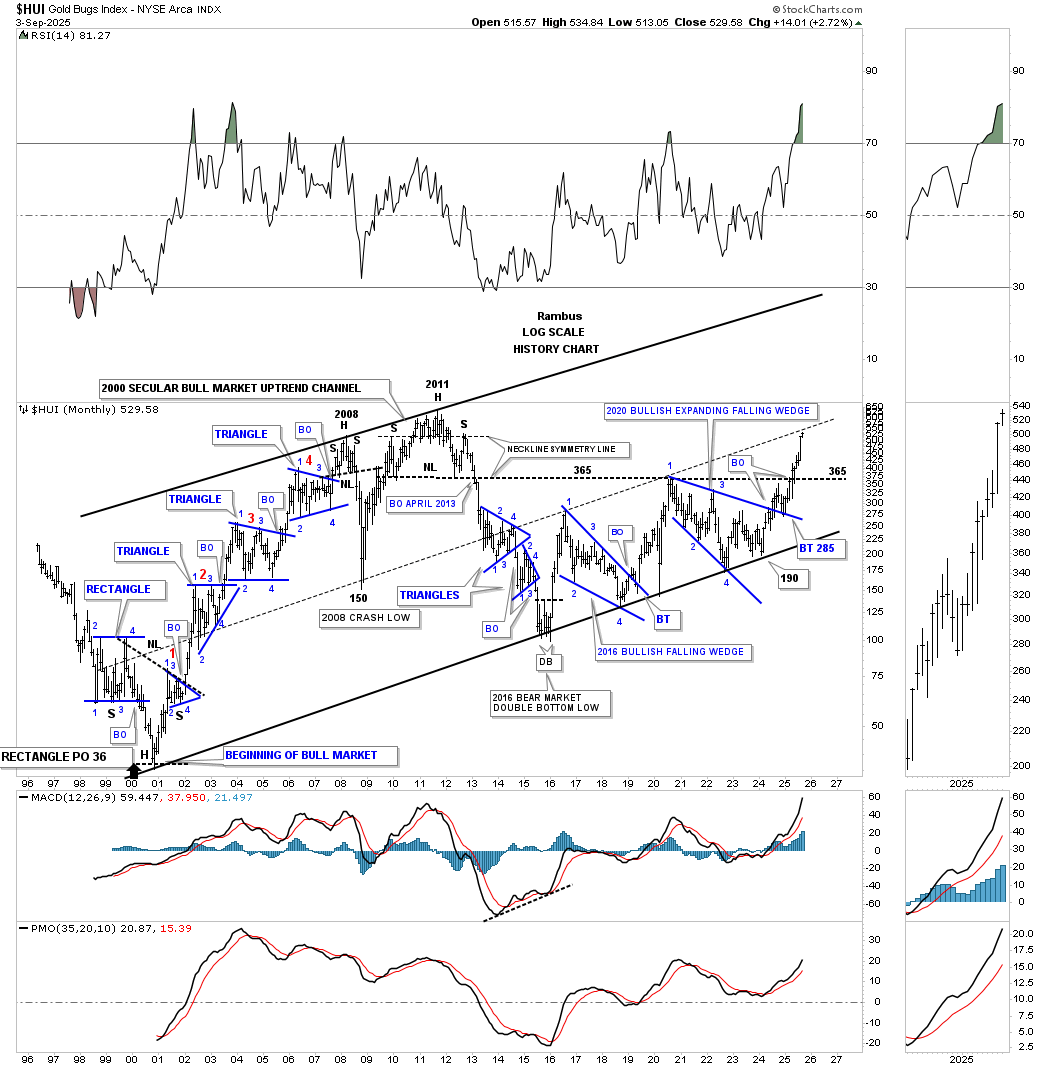
The bear market in the precious metals complex officially ended in 2016 after the first leg up of the secular bull market, which ran for eleven years from 2000 to 2011, came to an end with a multi-year H&S top in most of the PM stock indexes.
The new second half of the secular bull market that began at the 2016 low had been a slow and laborious grind higher, with two very large consolidation patterns – the 2016 bullish falling wedge and then the 2020 bullish expanding falling wedge – forming the 2016 uptrend channel, which is just part of the 2000 secular bull market parallel uptrend channel.
Those two very large consolidation patterns took the wind out of the sails for most of the investors in the PM complex, which is the job of consolidation patterns. The most recent 2020 bullish expanding falling wedge is the largest consolidation pattern that the HUI has ever built in its entire history, so if you survived that one, you can congratulate yourself.
As the 2020 bullish expanding falling wedge is the largest consolidation pattern the HUI has ever built, then we can assume the impulse move will also be the largest in history. As you can see, when the top rail was backtested in January of this year at 285, it hasn’t looked back. The neckline extension line taken from the 2011 H&S top was resistance when the 2020 rally came to an end and the 2020 bullish expanding falling wedge began to form. This most recent rally took out the 2020 high after a short pause and has now reached the center dashed midline of the 2000 parallel secular bull market uptrend channel.
On the left side of the chart, you can see how the first leg of the secular bull market that ran from the 2000 low to the 2011 all-time high formed one consolidation pattern on top of the previous one, which is classic bull market price action. There was a small H&S top in 2008, which led to the 2008 crash, which found support on the center dashed midline. That correction formed a V-bottom, which led to the last leg into the 2011 high. Again, note how the neckline symmetry line showed the high for the left and right shoulders during the formation of that very symmetrical 2011 H&S top.
A LOT MORE HERE …FOR SUBSCRIBERS
Unprecedented Bull Market in Precious Metals Complex: What’s Next?
https://rambus1.com/2025/09/04/unprecedented-bull-market-in-precious-metals-complex-whats-next/