Who’s Chart ?
A reader would like an update on this fib series chart posted in March.
Looks interesting .
Update from our reader : It was posted by RTV
with these comments
RTV
March 9, 2017 – 1:35 pm at 1:35 pm
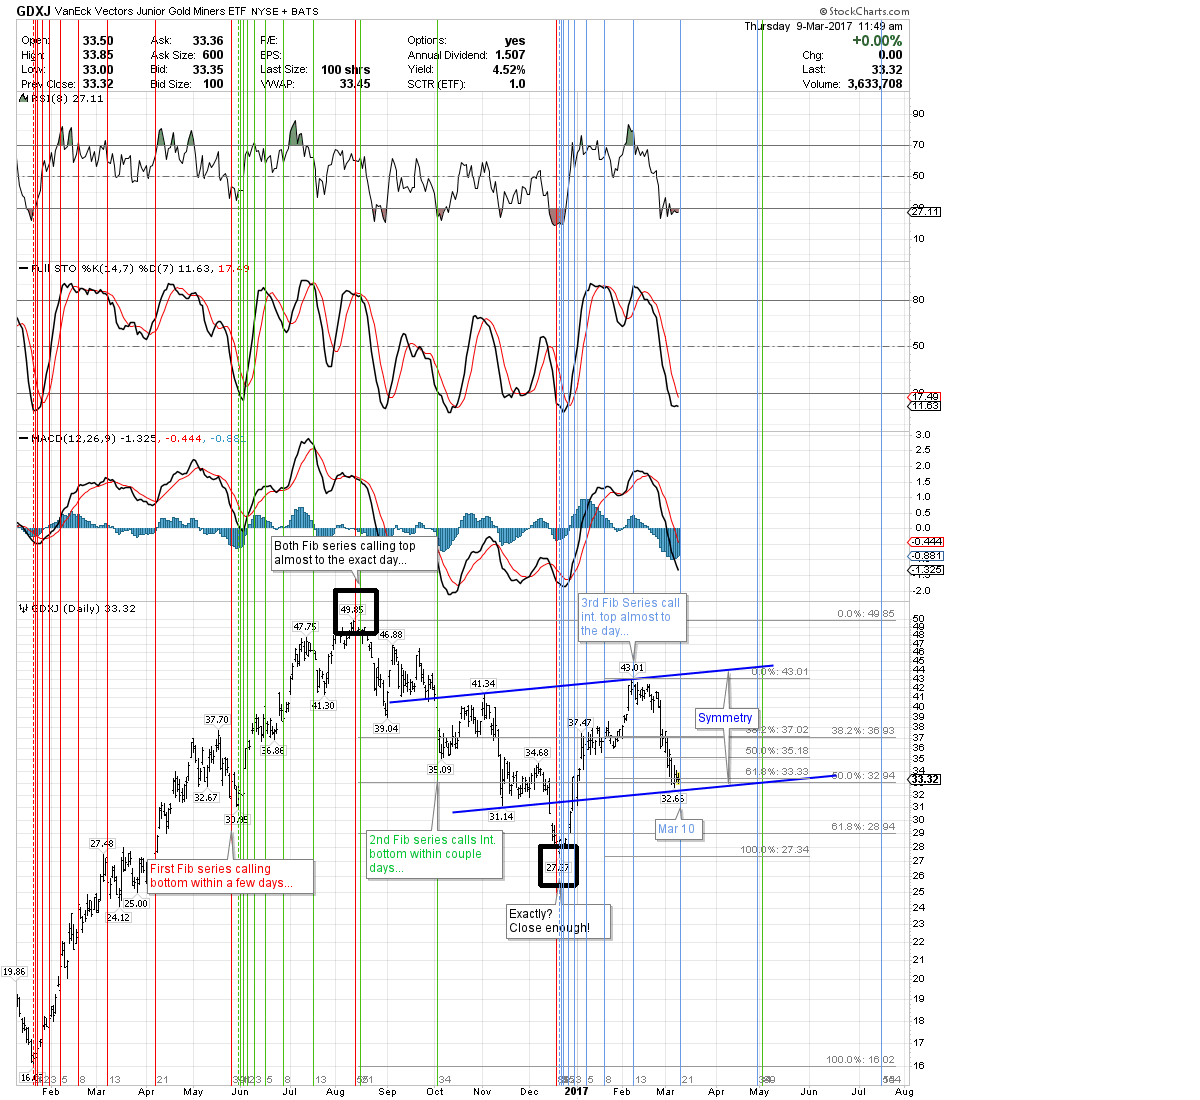
1. trading days, not calendar days.
2. no. next series will be 34 trading days, not 21 days, which is when i would expect the next trend reversal.
3. bear in mind that previous fib cycles continue to operate and can come along and exert their influence. for example, note that the december bottom was called based upon day 89 of the first (red) fib series.
4. also, when i see a confluence of one or more fib series, such as the august top, i will pay that special attention. this will also occur around the end of april/beginning of may, when day 34 of the 3rd (blue) fib series and day 89 of the 2nd fib series (green) fall within days of eachother.
5. one last comment – bear in mind that the next 34 trading-day period does not necessarily mean that price will roll higher. remember, that price can trend up, down, and also sideways! but whichever way this market proceeds – up, down, or sideways – i expect that to change about the first of may.