Reading Termination Wicks
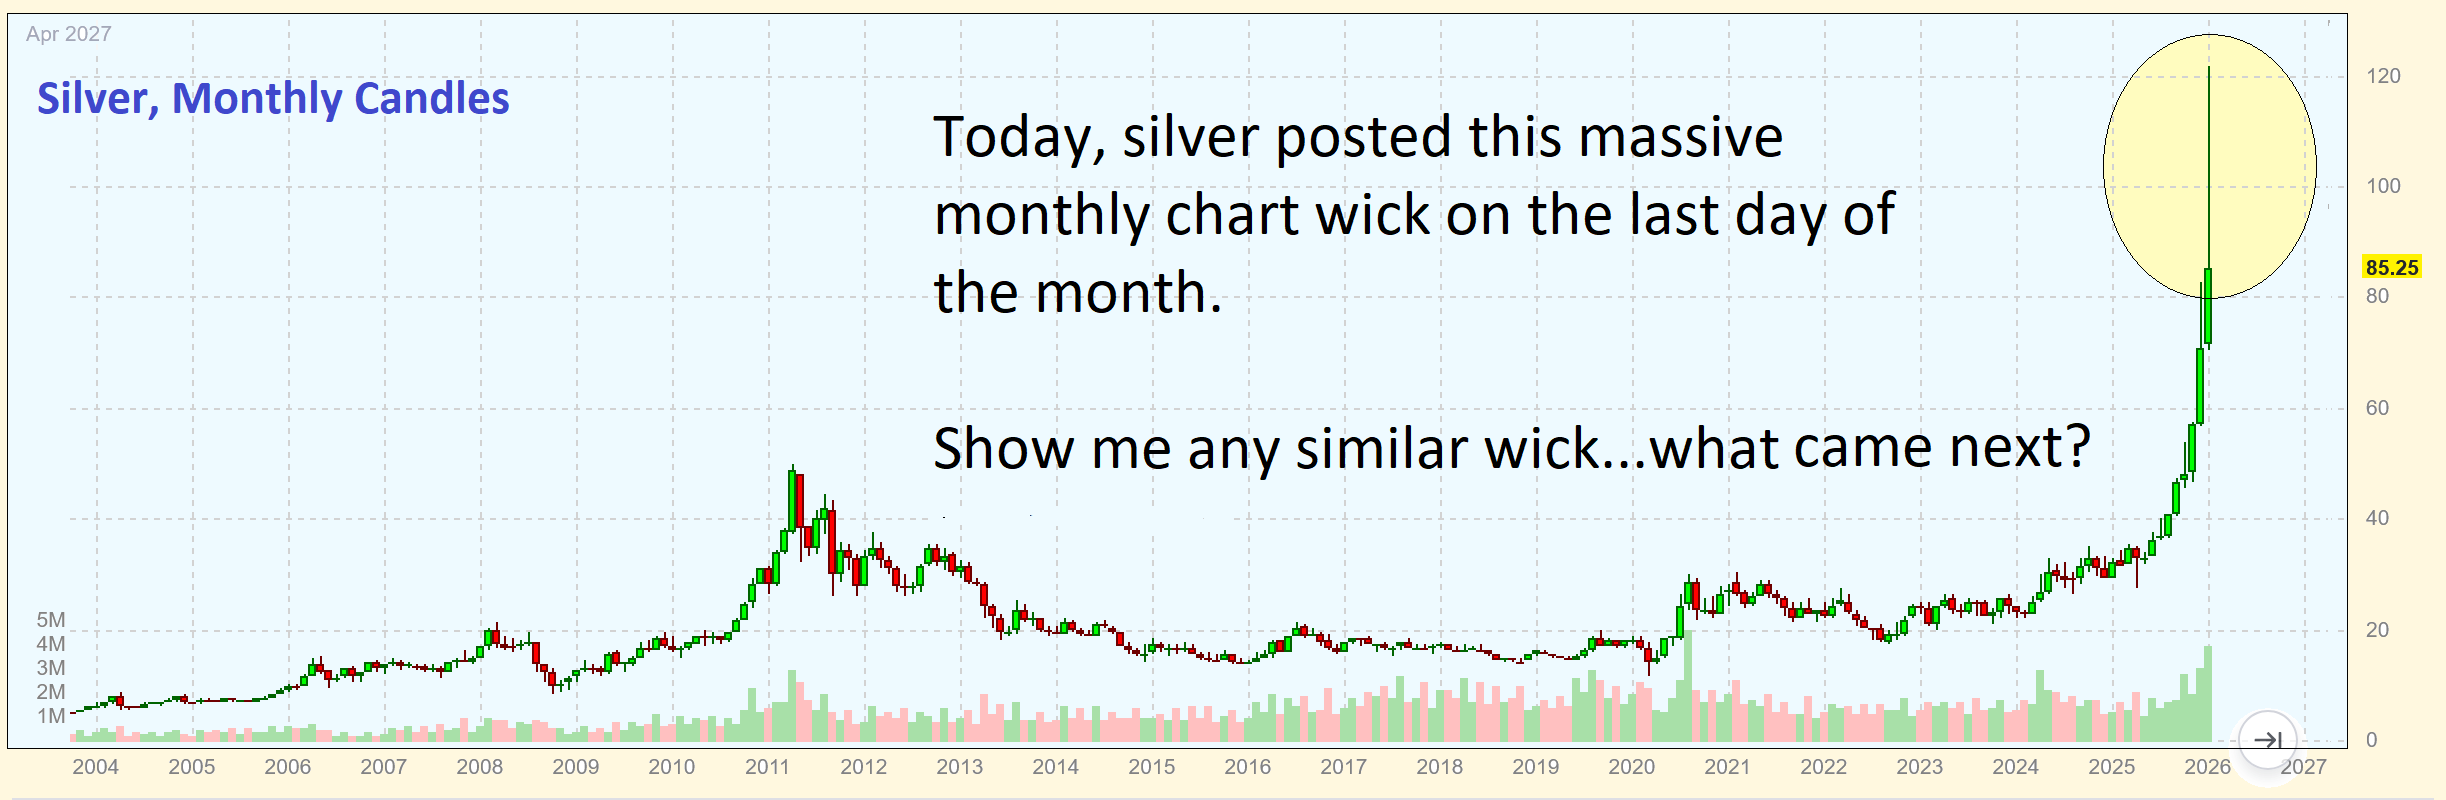
What you are seeing on the chart shown below is called a bearish reversal wick. I call them termination wicks. Whatever the name, a very long candle wick is informative for chart readers because it captures the mood of the period and helps with decision making for trading the periods that follow. This wick today was exceptional. Silvers moves higher had been very aggressive all month, but once refused its price rejection was profound and severe. The strength of the reversal is suggesting that this decline in prices will not end as quickly as bulls might hope.
Farner — I would be interested in your comments on the article posed immediately before this one — posted by Columbia — “what the hell happened today” — and whether the info contained therein changes your opinion??
If you have time of course!
Sure, I just read it actually and found it amazing. Something is up alright. There are always shenanigans taking place in this market. If I ignore technicals and put my perspective on politics instead then silver is still a buy and probably a good one. In that case we can ignore the huge negative candle wick and just stay in the game with confidence we know where we are going. Its tough to do that though because with silver it seems everything is an exception to the rule. We will just have to go with our hearts on this one. Price will rebound by the way. Just as it should following a massive sell off. But for the remainder of the year we might be selling the bounces rather than buying pullbacks. If nothing else it will have our focused attention until the next big price event.
Wouldn’t you just know what a coincidence today’s “termination wick” is. It will be for the daily, weekly and monthly chart time frames. Wow… just an amazing coincidence!
The concern is for the wick on the monthly level. If we had seen the same event happen on the 29th or 30th, price would generally rebound quickly so that no chart damage was done when viewed on the month. This case did not leave that opportunity open because it came on the last day of the month, so it leaves doubt about the sustainability of the the bull. As I pointed out in the chart drawing, find me a similar wick on any other commodity chart that does not subsequently have a negative outcome. Almost all of them lead to bear markets.
Have you got one for me?
YES I DO…I HAVE 3 FOR YOU….WHAT CAME NEXT ?
NOTE
AMAZINGLY FOR THE LAST 9 MONTHS REGARDLESS OF THE WICKS… THE PRICE NEVER WENT BELOW THE PREVIOUS MONTHS CLOSE . FROM THIS PERSPECTIVE WE DONT HAVE A PARABOLIC RISE BUT AN ORDERLY RELENTLESS BULL
I see your wicks. I am not referring to just any wicks though but to wicks you only see when a trend gets terminated. Anyway I am not saying the silver bull is ended. Only that it may be stalled out for longer than others imagine. How many people rushed out and bought more silver or miners today? How many will be filling their boots with Calls come Monday? That candle gives me doubts. I know its not popular to say such things here. I am supposed to be rah, rah, rah for the team.
But I don’t feel it after todays action.
I agree with you. I believe we will drift down and test the $50 area in the next couple of months before we get another bull leg. I was selling some of my silver stack and cost averaged my sells into this bull. My 1st sells were at the $54 level and have sales in the high 70s low 90s and low 100s. I am going to the Long Beach coin show in mid February looking for gold, silver libertads and numismatics. I still have a good silver stack but I was overweight in silver bullion.
should get the typical ABC bounce, up some and then boom one more time.
Ok, but your opening salvo in response to Fully’s chart excludes an evidence that counters your predetermined outcome, which it should not. We don’t know if this is the ‘trend terminating candle’ in real time. But yes, I think we can all agree that the trend terminating candle is followed by candles leading in the opposite direction.