GBTC
Log Chart – Coming up on resistance:
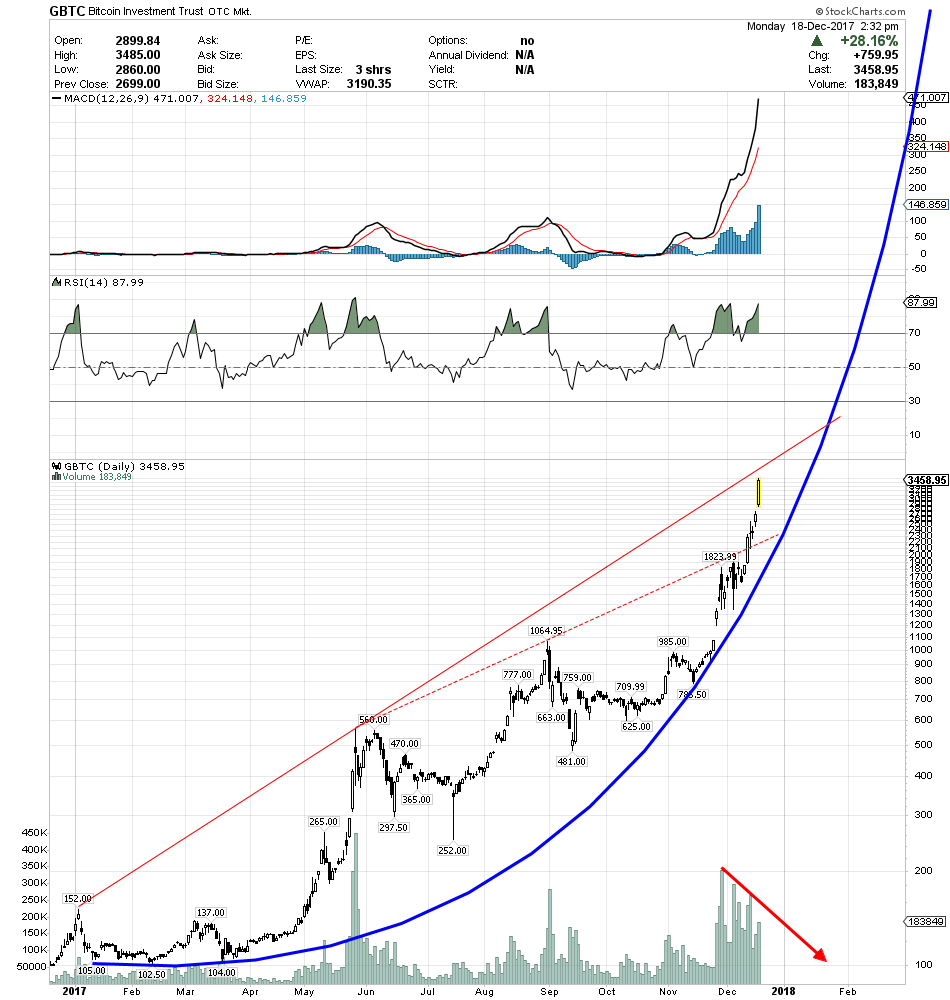
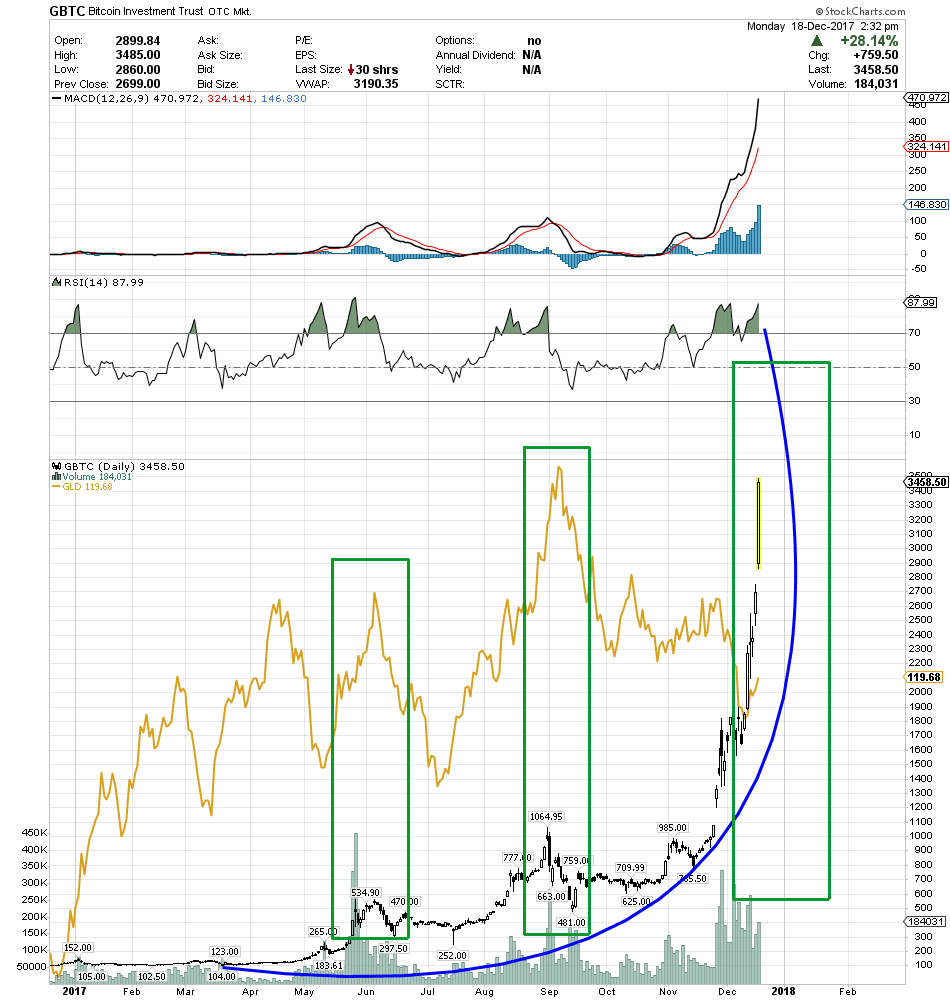
On the Linear Chart below – BTC looks like its made a left turn onto “Terminal Street” on falling volume. Every rocket ship eventually runs out of fuel. As a side note – just observing the interplay between BTC and Gold – it looks like there has been a correlation on the two major rallies and peaks during 2017.
Is BTC leading now? That would be nice!
Great charts RTV. Thanks.
It has bent parabola backwards!
from a parabola to a french curve…
So now I understand what it means to go parabolic. I remember the spike in GBTC in May thinking. It’ can’t go much more higher hahaha silly me. Missed out on all this.