One For the Bulls
Each Market and Time Frame seems to have its own unique Moving Average that best defines its bull and bear phases
The Gold Monthly Chart is Probably the most important timeframe but one we rarely analyse .
The 20 Month Exponential Moving Average has been incredibly consistent ….and here we are again
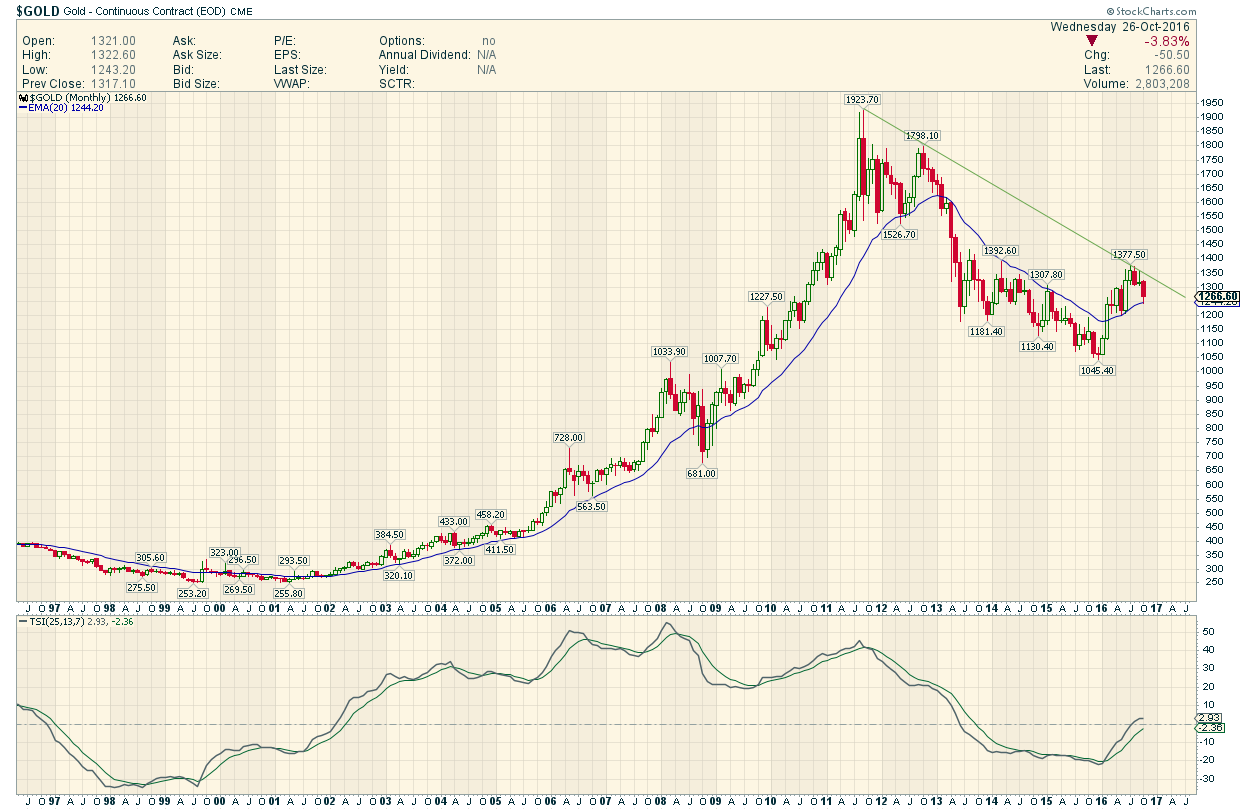
The one time this MA failed was during the Great Financial Crisis of 08…when Everything failed
The exception that Proved the Rule
Also Note on this chart the WHY Gold stopped where it did on this move
A simple long term chart with one simple moving Average and One simple down trend says a lot more than
hundreds of short term noisy chart