Silver Will Fall (updated with a new chart)
Greetings Goldtent. I have been going over the state of silver this evening and after a long look at the weekly chart I saw what I was looking for to use as guidance on the coming reversal. I hope you will find this chart as helpful as I have as it pretty much sums up my sentiments from early yesterday where I warned a sudden drop was about to take place. And indeed we got that drop right on cue. Silver dropped from 87 to 81 over the course of the day and even now threatens to go lower still.
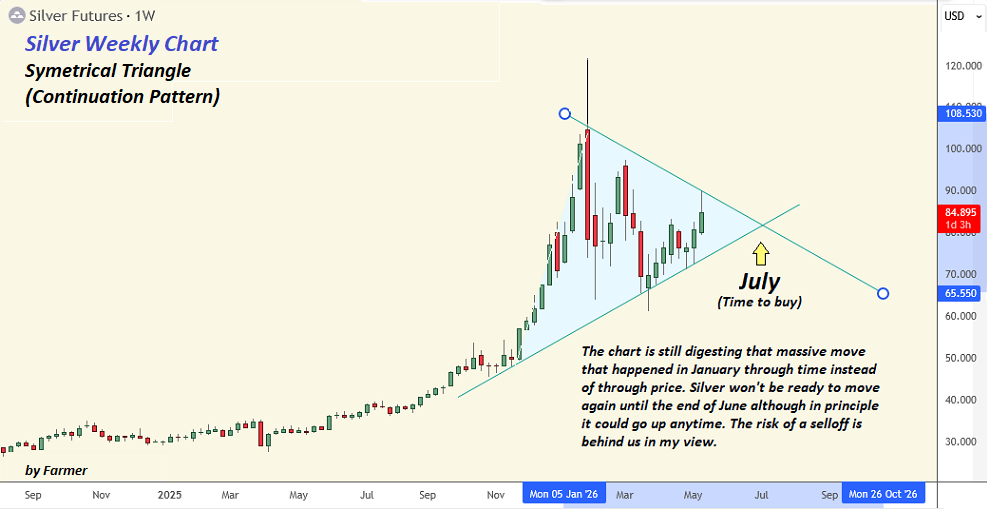
In this chart however it is easy to imagine price running right back up again so it differs somewhat from my other work. Needless to say I like it. As long as we stay more or less within the lines and the symmetry of the chart is not broken then we can look forward to early July as liftoff for metals and miners. That should be a relief to all of us, some of whom are a touch stressed by the slow evolution of the pattern and expected reversal. Just keep an eye on the lines of support and resistance and use that as your guide to what is happening today. As long as price doesn’t stray too far outside the boundaries then everything will be just fine.
Farmer — sincerely appreciate your expertise and that you share with us your thoughts on PM’s. Wish I had your skill!
Thank you very much Kewl2. Thats just the words I needed tonight to help me sleep well. Cheers!
Farmer — now that Friday is toast (literally) — perhaps you could share what your charts are projecting for the coming weeks????
Sure. Which chart? gold, bitcoin, Crude oil….a company?
PM’s — gold and silver — thanks in advance (perhaps new post as this one is getting hard to find — way down the stack now).
Also – curiousity — if China, Russia AND USA were to all (more or less) simultaneously announce entirely new “gold backed” monetary systems (not necessarily the same system but wth similar properties) — what impact would that have on charting? Wouldn’t this make “old charts” irrelevant?
BEAUTY CHART FARMER
I LIGHTENED UP WHEN YOU POSTED THIS MORNING
I DO SEE SUPPORT AT 80 ON THE DAILY CHART…SEE ABOVE
Thanks my friend. Silver is dropping hard again today. More than I might have expected. Take care if price crashes through the bottom because it will mean the stock market is about to come down too.
“More than I might have expected.”
First, kudos on stepping up with your post in such a timely way.
I was remiss in not running one of my usual daily scans, which reported IT (interm term) buy signals for ZSL and GDXD both. Two of 10 out of 260 on the watch list. These signals tend to be quite spaced out.
In the context of my remarks over recent months, I wasn’t surprised to see these (better late than not).
I don’t use EW directly in my own work, but I respect Sam and Art for their work. They amount to early heads up for me.
But my charting wasn’t in alignment with their recent Bottomsz Inn calls. And I said so.
AND that left me without an EW structure at the big picture level, beyond some nebulous larger Wave 4.
If the initial Feb drop was an A, and we’ve been teasing in a B ever since, then C could still echo the severity of A down as its bookend.
And then we pull in Plunger’s remark that this runs into July. C would normally take THAT long, yes.
So this points to more than your wedge promises.
I’m also in the Liquidity Drives camp, having watched crypto confound “Believers”.
I do not use Faith in my charting (or trading). And if PMs take it on the chin again, it will be a warning for those riding the Everything Bubble including NYDA and SOXL.
If this resonates, start watching everything Warsh does. Carefully.
PS – to Fully on his “What do I win?” (His claim to the prize for calling the bottom for GDXJ)
I did express my belief that we would go lower within this correction. We’re not there yet.
So I haven’t forgotten that Challenge that I posted. (Take one stab at calling a bottom for GDXJ)
And I still haven’t put my “One And Only” call into the ring.
I do plan to do so.
Bull flag in the works?
https://x.com/BroadLuis/status/2055228425934193116
Patience.
Ignore that guy pedro_deleon. His chart does not work. It is most certainly not a classic bull flag as he claims. The points do not line up unless you are squinting and a little too lazy to prove it does not work. He is wrong in the assessment.
Thanks Farmer. I don’t use “classical” TA like that in most cases, but I do use channels for resistance and support. His flag (and its time frame) suggests we need a month before support shows up, and that aligns for me.