USERX Chart from Dec + Another View of the $USD
This evening I stumbled across this chart I posted back on 12/18/2015 when I suggested the bottom was in. Tonight my eyes immediately went back to the 2000 time frame, noting where prices pulled back to before regrouping and heading higher in a series of fits and starts. This chart is yet another line of evidence supporting that our little 10% pullback experienced over the past week may be as much of a retrace as we get. While guys like Gary Savage are focused on retracing to the mid-March consolidation zones around 170-180 on the HUI (or even the 200MA!), I think we should look left quite a bit further when seeking our consolidation zone to be keyed into. I didnt change this chart a bit except for adding a breakout/backtest pivot with directional arrows on the S/R level both at 2000 and now. The rest is unaltered from Dec. What is also really interesting is the clear reverse symmetry we got back in the 2000 timeframe and seeing how that again could be playing out here. To me it suggests that after the next big runup to most of our targets— maybe around HUI 400, we really should think about locking in profits because this pivot could likely get tested again over the next year or more frustrating many and causing lost fortunes. Just something to watch.

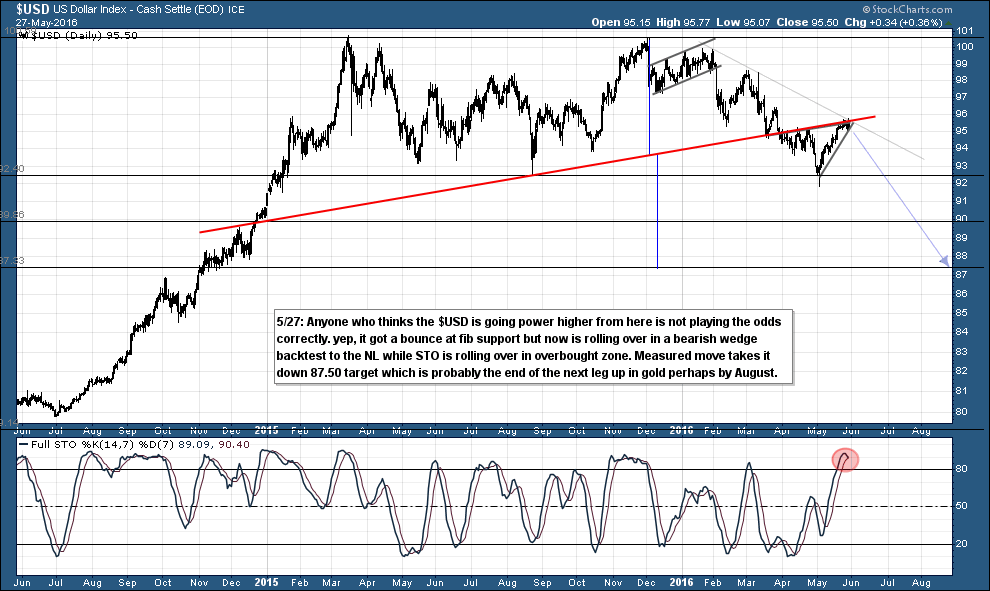
Perhaps a somewhat fresh take on the $USD helps support this view.
Mark, Very nice work. I am in the same camp as you are. I am favoring a shallow correction despite the brutal action of the past week and the current house of pain some may be experiencing. I tend to approach the market from a perspective of market psychology and we all know the tug a war going on out there between the sold out gold bugs and position holders. Most want into this market in the worst way, however their gurus have led them to the sidelines. I just don’t see much likelihood of Mr. Market serving up a “gentleman’s entry” for these people to enable them to correct their past mistakes. A chance to regroup and enter where they should have stayed in in the first place if they had bought earlier.
If this is the start of a bull market Mr. Market’s objective is always to reach the top carrying as few riders on his back as possible. Therefore is it really likely he is going to stoop down on his knees and let these psychologically scarred investors a chance to get in at yesterdays prices that they refused to recognize as value in the first place? Not likely is my response.
My work targets the HUI 350 area as an ultimate destination before the first ultimate stop.