Gold vs Swiss Franc
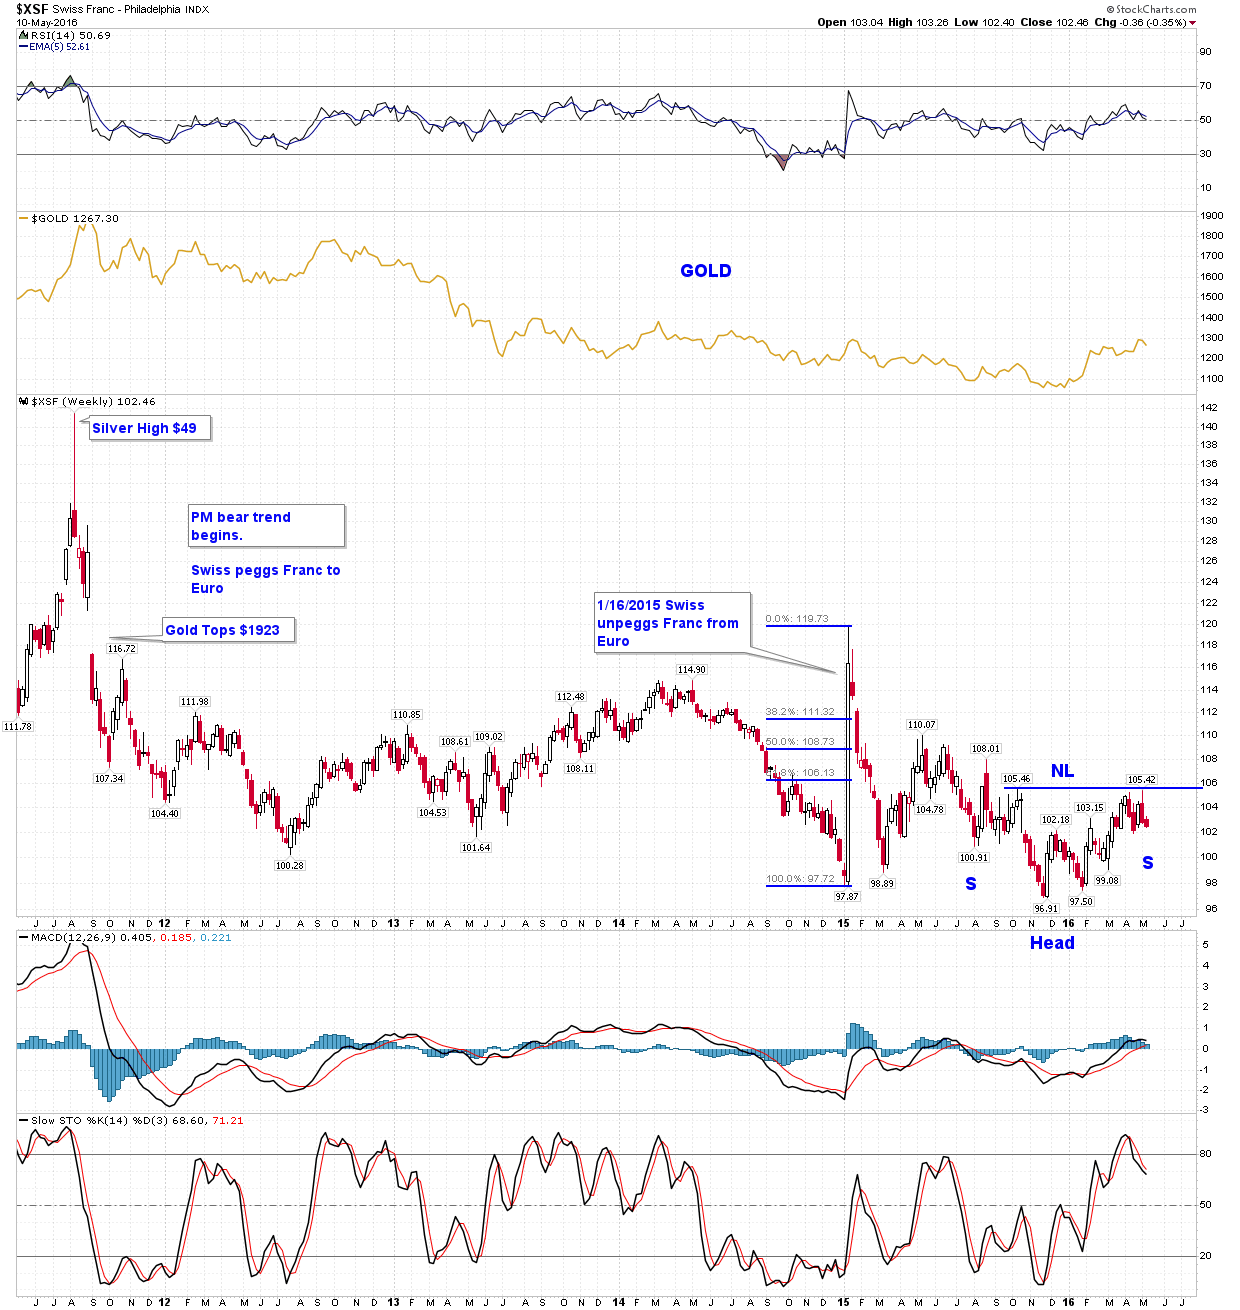
Jan 2015 Swiss un-pegged their franc from Euro. AND gold shot up big time. Made new high and spooked many EW analyst to change the gold trend to bullish. later gold made new low this year and reverse the trend to long again.
It appears Jan 2015 was the day XSF turned bullish and it has been in corrective mode for whole year. Now XSF has put the final bottom and ready again to go higher. The weekly chart shows that XSF is building bottom H&S and is close to putting RS.
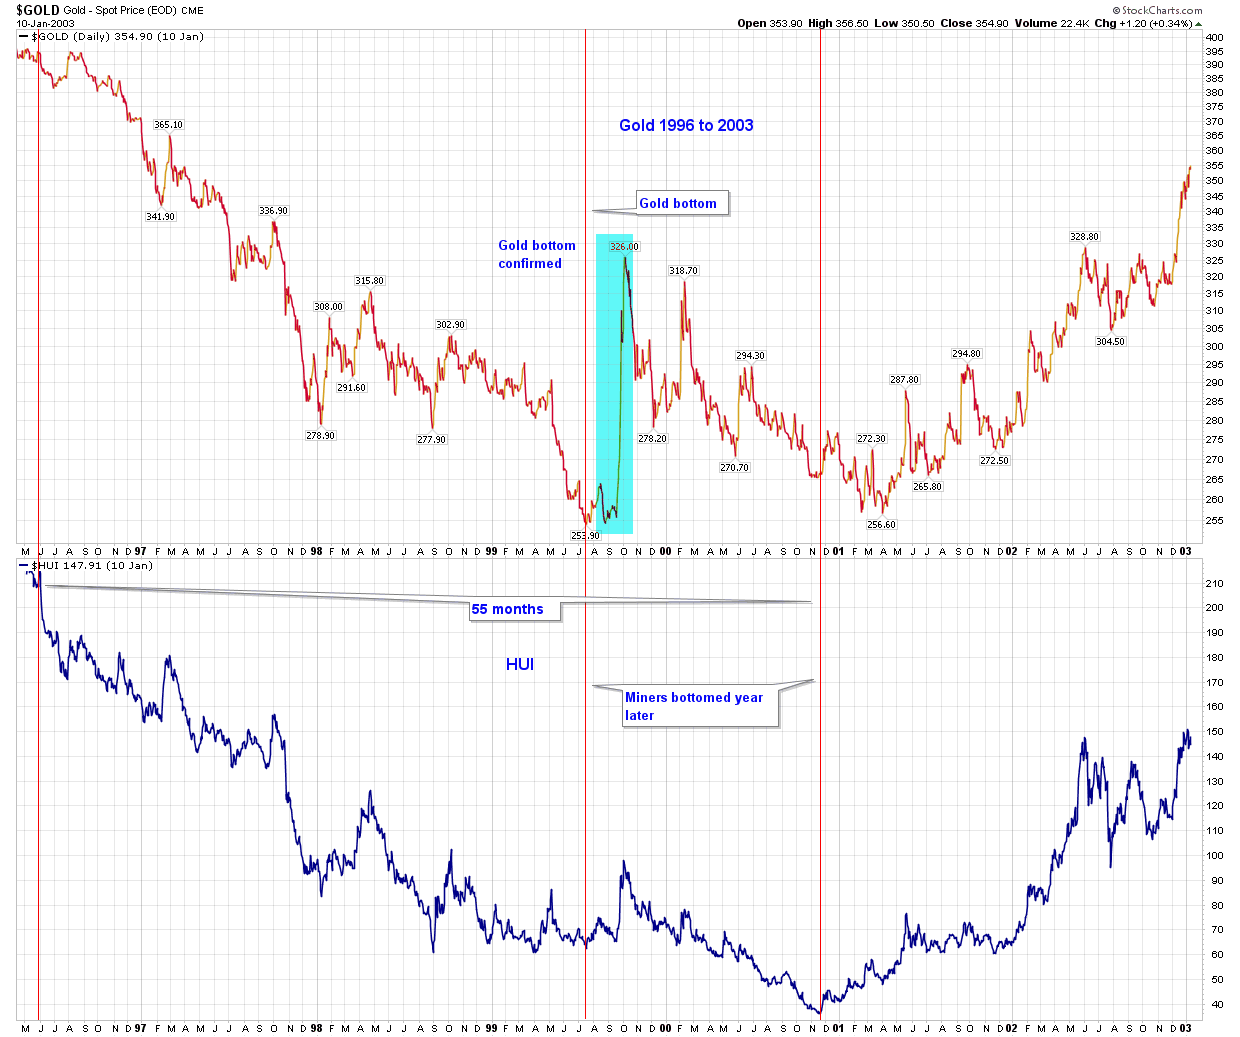
XSF weekly chart appears similar to Gold bottom in 1999 when it shot up and subsequently corrected down for a year in 2001. After the correction was over gold continued higher in 2002 to 2007.
If XSF also follow the same path it is another convincing clue for gold’s new bull market.