IN SPITE OF THE MANIACAL GLOBALIST AGENDA
ASSASSINATION CULTURE
HOW DMSO HEALS THE NERVES
NEW RULES
IT'S TIME YOU KNOW THE TRUTH
OBAMA WAS THE TARGET
THE TERMS OF THE IRAN DEAL ARE IRRELEVANT
THE LOCKDOWN DISSONANTS
GOING NUCLEAR
THE AMERICAN SYSTEM ( OF ECONOMICS )
THE EVE OF DESTRUCTION
HANTAPOCALYPSE
GLOBAL FRAUD INDUSTRIAL COMPLEX
2026 MIDTERMS
UNIVERSAL BASIC INCOME
A TESTIMONY
Goldtent TA Paradise
CONTACT
GRIN : ALIVE AND WELL
JOIN THE DISCUSSION
READ OUR DISCLAIMER
GOLDTENT STATEMENT OF NON VIOLENCE
WE ARE THE MEDIA
A CHRISTMAS MIRACLE
RELEASE THE EPSTEIN FILES !... DONE !
DIABOLICAL
BUCKWHEAT
THE WORLD AWAKENS
AI PHARMA PARADIGM SHIFT
NEW GROUP
MIGHT MAKES RIGHTS
Polls
 Loading ...
ARE YOU ?
CROSSFIRE HURRICANE
MAGA VS FAGA
THE EXPOSING OF THE SATANIC FORCES VIA THE EPSTEIN FILES
TRANS INSANITY
IT'S ALL IN THE FAMILY
FULL GOLD CROWN
LET THE MAN COOK
LIES DAMN LIES AND STATISTICS
THE KING
SCIENTISM
COVID 19 "VACCINES" AND CANCER
NAZISM / FASCISM ALIVE AND WELL
TRUMP JUST DECLARED WAR ON THE BACKBONE
SILVER IS A STORE OF VALUE AND IS KEEPING UP WITH INFLATION
STANDBY
DID VACCINES REALLY SAVE THE WORLD ?
IT'S TIME TO TELL YOU EVERYTHING
EMERALD ROBINSON EXPOSES. VENEZUELAN CARTEL ELECTION RIGGING..WATCH THIS LINK FOR UPDATES
- **MADURO COUP DETATE IS PRIMARILY ABOUT ELECTION RIGGING **
- BEHOLD THE NARCO TERRORIST SENATOR LIST
- Maduro’s Ex-Insider Turns Snitch, Sends Trump an Explosive Letter
- MARIA CORINA MACHADO
- SECOND HIGH LEVEL VENEZUELAN WHISTLEBLOWER LETTER TO TRUMP
- THE WORLDWIDE ELECTION RIGGING OPERATION AND THE 2024 DRAMATIC STICK SAVE
- VIDEO PT 1
- VIDEO PT 2
- VIDEO PT 3
WESTERN ALLOPATHIC MEDICINE IS A DEATH CULT
NEW CANCER TREATMENT PROTOCOL
WHY "SMART" PEOPLE
GEORGE ORWELL
TRUMP'S WAR ON THE CARTELS
BE YOUR OWN DOCTOR
- * DMSO HANDBOOK *
- * THE RANT *
- * THE UBIQUITOUS PHARMACEUTICAL SOCIETY
- 100% CANCER REMISSION (MONOCLONAL ANTIBODY)
- 2ND SMARTES GUY CANCER PROTOCOL
- ALPHA GAL TREATMENT
- ANTI PARASITIC DRUGS SHOW STRONG ANTI CANCER EFFECTS
- ANTIPARASITIC VETERINARIAN DRUGS SHOW PROMISE FOR CANCER TREATMENT
- BLOOD PRESSURE SCAM
- BREST CANCER AND THE VAXX
- BRUSH YOUR TEETH DAMMIT
- C D S ( CHLORINE DIOXIDE SOLUTION )
- CBD GUMMIES AND TIGER WOODS
- CHEMOTHERAPY FAILURE RATES
- CHLOESTEROL : A BIG PHARM BIG CON
- CHLORINE DIOXIDE DETOX
- CURCUMEN
- DANDELION ROOT
- DISSOLUTION OF SPIKE PROTEIN ( NATTOKINASE)
- DMSO : MIRACULOUS PAIN TREATMENT
- DMSO AND CASTROIL FOR NEUROPATHY
- DMSO2
- DOXYCYCLINE and CANCER: At Least 12 Anti-Cancer Mechanisms of Action
- EARTHING
- FENBENDAZOLE Q AND A
- FIBROUS BLOOD CLOTS TREATMENT
- FLCCC VACCINE DETOX PROTOCOL
- HEALING POWER OF ILLNESS
- HEALTHY GUT BACTERIUM MICROBIOME
- HIGH DOSE ( IV) VITAMIN C A STRONG CANCER TREATMENT
- INFLAMATION
- IT'S DEPRESSING : ANTIDEPRESSANTS KILL
- IVERMECTIN AND FENBENDAZOLE TO PREVENT CANCER
- IVERMECTIN PILLS HERE
- IVERMECTIN PROPHYLACSIS
- IVERMECTION CURES CANCER ?
- LIPITOR WARNING
- LYME DISEASE CURE
- METHYLENE BLUE
- MICRODOSING LITHIUM BOOSTS YOUR BRAIN AND PREVENTS ALZHIEMERS
- MRE ON DMSO
- NATTOKINASE …SPIKE DETOX
- NATTOKINASE : THE HOLY GRAIL FOR SPIKE DETOX
- NATTOKINASE DISOLVES MICROCLOTS
- Nattokinase Dissolves 84% of Amyloid Microclots Within 2 Hours
- NEW CANCER PROTOCOL
- NEW STUDIES AND PROTOCOLS
- NICOTINE THE MIRACLE CURE
- PSA SCREENING : A PUBLIC HEALTH DISASTER
- Ranking the Top 19 Terminal Cancer Repurposed Drugs
- SALT SCAM
- SHEDDING IS REAL : WHAT CAN YOU DO ABOUT IT ?
- SSRI ANTI DEPRESSANTS ARE A HORROR STPRY
- TETANUS
- THE GREAT ALZHEIMER'S SCAM AND REAL CURES
- THE GREAT BLOOD PRESSURE SCAM
- THE VEGAN SCAM
- TOP TEN DETOX ITEMS
- TREATING COPD NATURALLY
- TREATING COPD NATURALLY
- UVBI ( ULTRAVIOLET LIGHT BLOOD IRRADIATION )
- WHY HERBS AND SUPPLIMENTS WORK ( McCULLOUGH)
- YES VIRGINIA..A CURE FOR CANCER
WHAT IF EVERYTHING YOU THINK YOU KNOW
MAYBE THE US DEBT
NUCLEAR WEAPONS ARE A FANTASY
MASS TRUMP PSYCHOSIS
THE CULT OF MODERN MEDICINE
WHEN THE FINANCIAL SYSTEM IMPLODES
THE THEORY OF EVERYTHING
THE OBLITERATION OF VIROLOGY
A BRIEF HISTORY OF THE ISRAELI PALESTINIAN REGION
DEFINE WOKE
VACCINES IN GENERAL
PCR TEST WAS COMPLETE BULLSHIT
THE ANTI-VAXXERS
BAD BATCHES
WHY SOME HAVE ADVERSE REACTIONS AND OTHERS DON'T
WHERE DOES ELECTRICTY
ANTIVAXXERS
* WELCOME TO FORT DETRICK
* STATISTICAL TRICKS
* THE BASIC LAWS
* TOM LUONGO'S THESIS
* WHAT IS A WOMAN
* WUHAN MILITARY GAMES
* OPTIMISM
* THE FREEDOM CONVOY
* NATURAL IMMUNITY IS KING
* 34% OF CANADIANS UNVAXXED
* COVID: ISRAEL VS PALESTINE
* THE THREE STAGES
* 100 MILLION AMERICANS
* GROUND ZERO
* COVID VACCINES CANNOT WORK
* HISPANIOLA
* PUBLIC HEALTH
* WHO ARE THE VAXX REFUSERS
THE ORIGINS OF COVID
POSTING INFORMATION
Polls
Loading ...
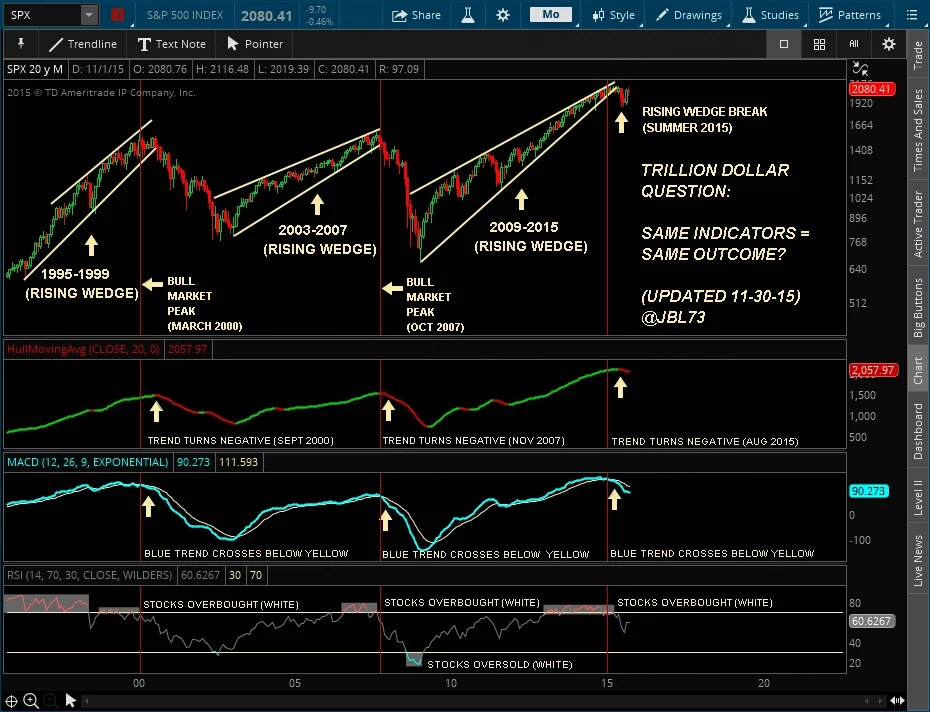
Won’t believe it till I see it…the plunge protection team will save the market!!!!
We are way back in 1995 so forget about a “bear” case until 2019.
This market is headed higher, much higher!
Thanks Sir Norvast of Gann for weighing in
Your comments are much appreciated Sir Norvast. Once I see a higher high on the S&P I will consider your market headed higher case. That would be a close above 2116 then 2135.