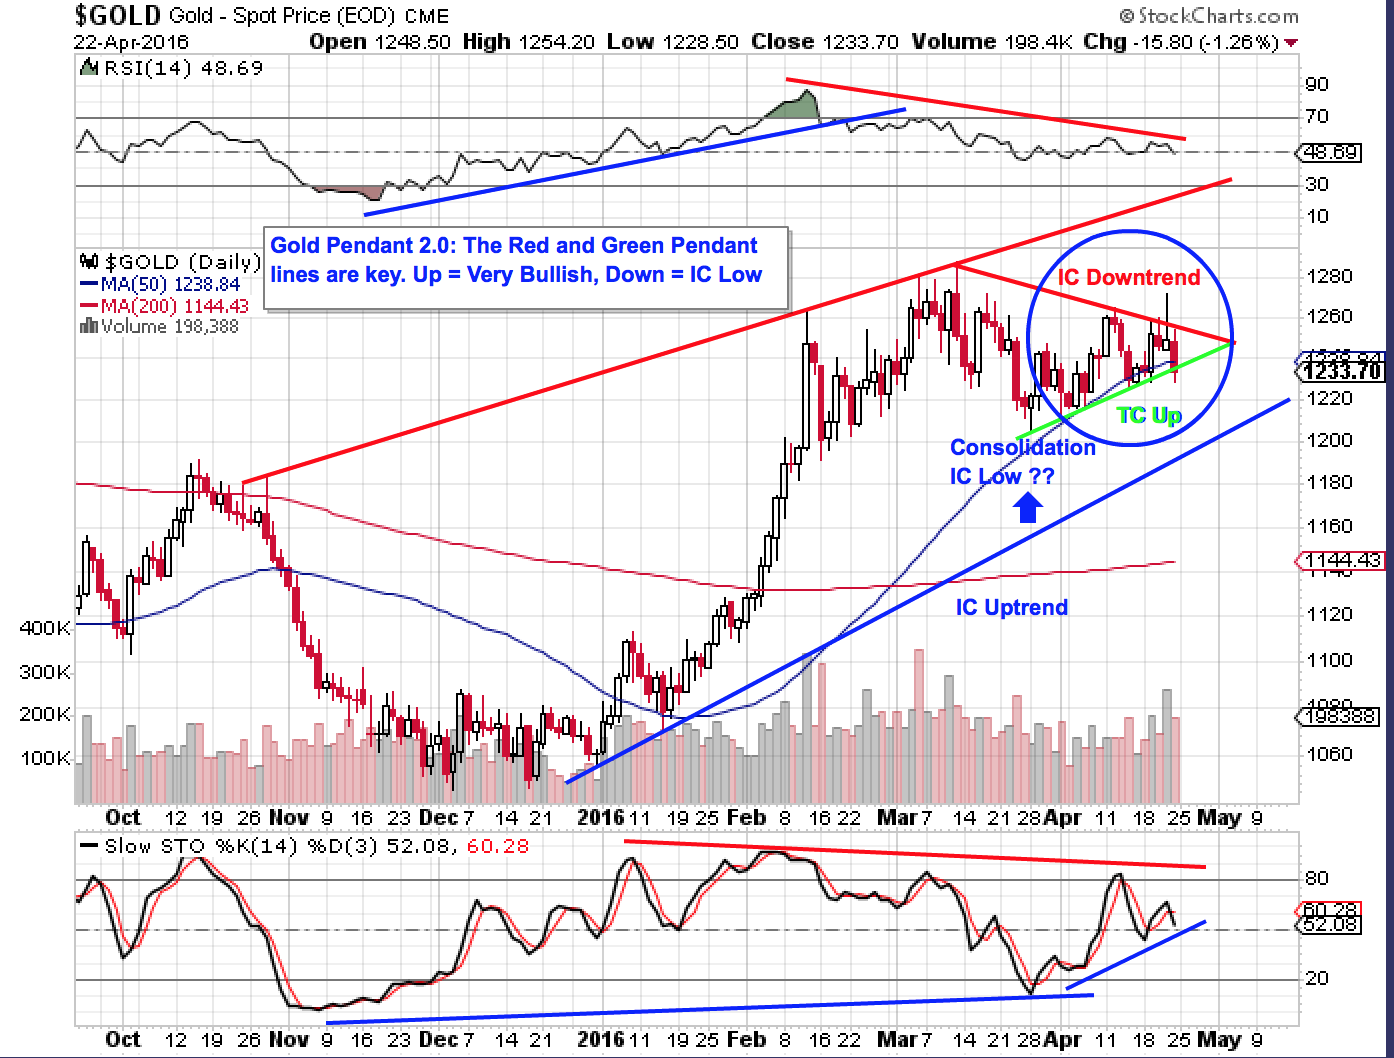
Gold Pendant 2.0
The first 7 month Daily Chart says it all. The Green and Red Pendant 2.0 lines are key Cycle trendiness on my chart.
I had mentioned previously that Gold could have had a “Consolidation ICL” in late March but these are extremely rare. We should know very soon as the wedge has little room left. A break up would be very bullish and a close below my Green line would likely signal a move into a TC Low sometime in late April to early May.
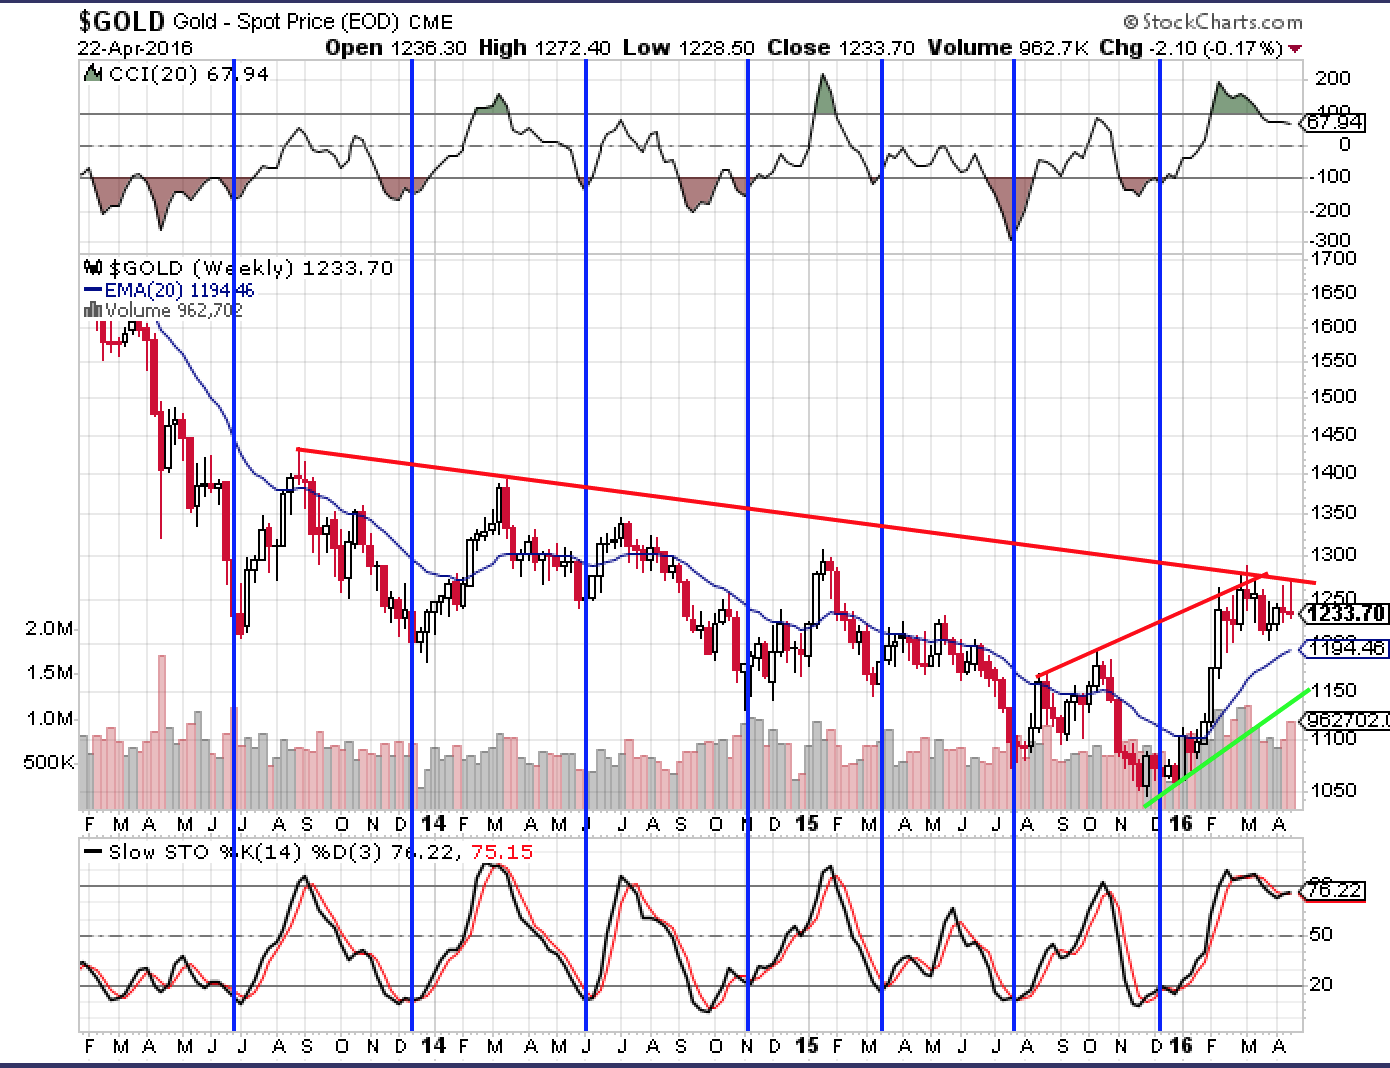
Second 4 Year Weekly chart provides a longer term view on resistance. Blue vertical lines shows ICL timing band to be 5-6 months.