EW Analysis
New poster here (Rambus refugee). I own some Elliott wave software I bought many years ago and thought I would share some current results from it. I have seen a number of different methodologies used here, all of which have their strong and weak points. EW is the same, so take this for what it is worth. One thing I will say though, when a number of different types of analysis start showing the same signals, one should probably take notice.
One bit of introduction – like any other system, after using it for a long while you begin to get a feel for when it is on to something or just churning out results. The following charts are unusual for it because it has latched onto some complete counts. It doesn’t do this often, but when it does it is usually right. Let me start off with a low count chart which gives a target for completion. As you can see, it has not analyzed enough points to show a completed wave. The thing I want to show here though is where, based on the rest of the waves, it thinks the complete wave should end:
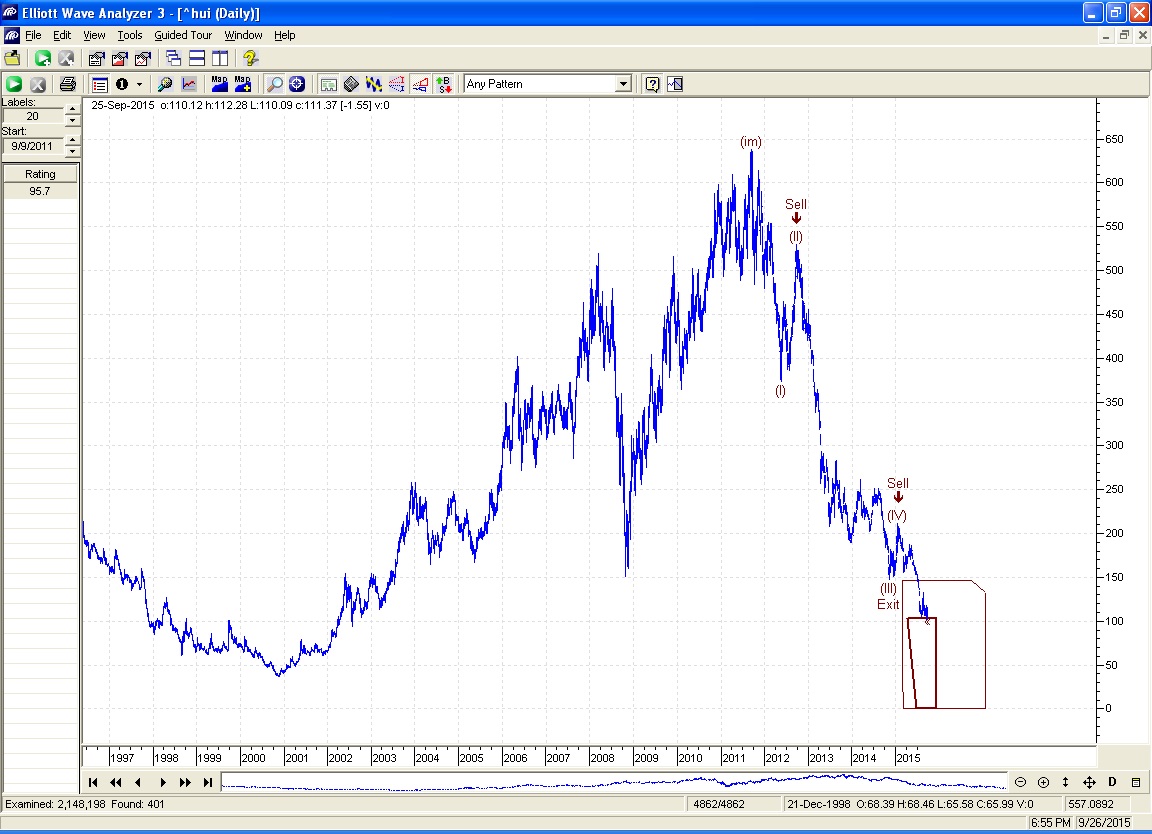
Note that the dark brown, thick box is the preferred range, the light brown, thin box is the possible range. The next chart is the one that grabs my attention, because it is so unusual for the software. It shows a complete wave starting from 2001 to the high in 2011 to the low this month. Refugees from the Rambus website might recall I shared a similar chart in October 2014. It too showed a completed wave. I mentioned then that it might not be “The” bottom, but was at least a significant bottom. I will say the same thing again here. (BTW, after calling the bottom in October, the index went on to rally ~30%) Here is the chart:
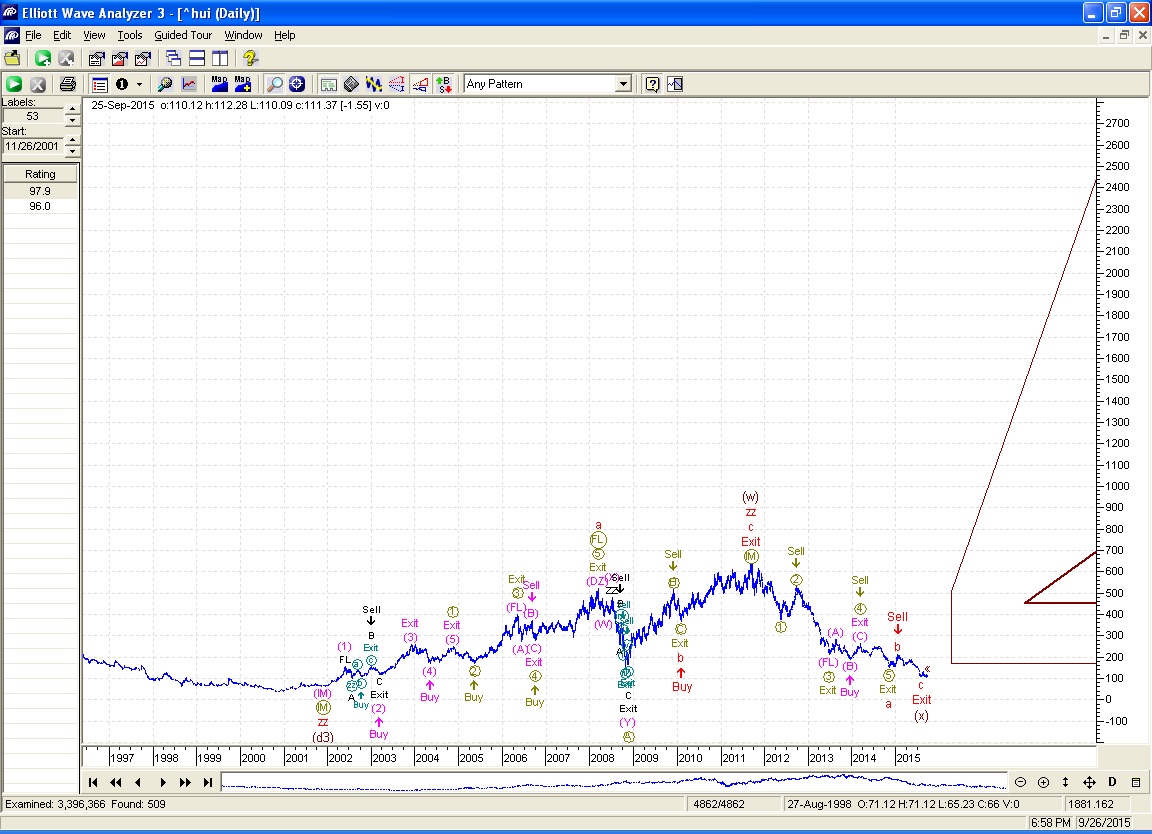
Note the target on the far right hand side. Again, the dark brown box is the preferred range. I have found that when correct, the target seems to be the left hand bottom point of that box. In this case it is ~545 days from now.
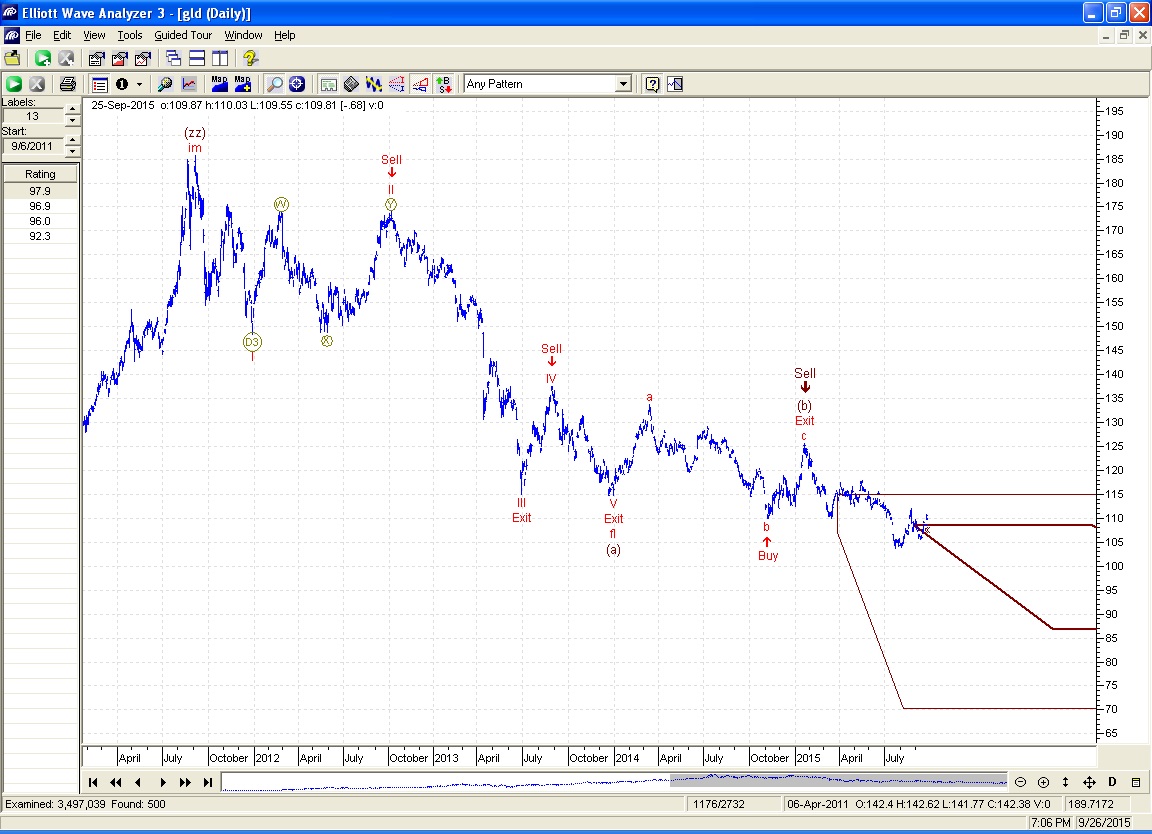
You might be wondering what this program is saying about gold? Well, here is the chart for it. Although it hasn’t yet confirmed a bottom, the target is right in the current neighborhood:
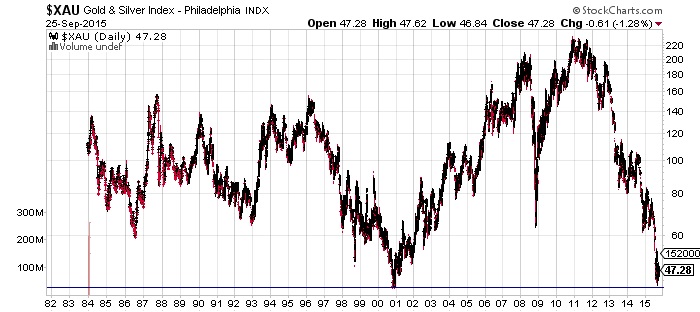
I will throw in one more chart that has nothing to do with EW analysis, but that I haven’t seen posted anywhere else that kind of makes you say hmm……
I can’t see the charts Ken. Please try to save them as jpeg files or something and upload them to the site. Thanks.
Excellent KenS
Glad you got your charts to post
Another Bullish Scenario
First time in years I have seen so many potential bullish charts in PMs
I am still bearish based on resistance right here and now
But I have been know to be wrong
Once was in 1959 , the other time I don’t remember
Very interesting perspective….thanks for sharing this. I like analysis that approaches things from a completely different angle than I do and this fits the bill for sure.