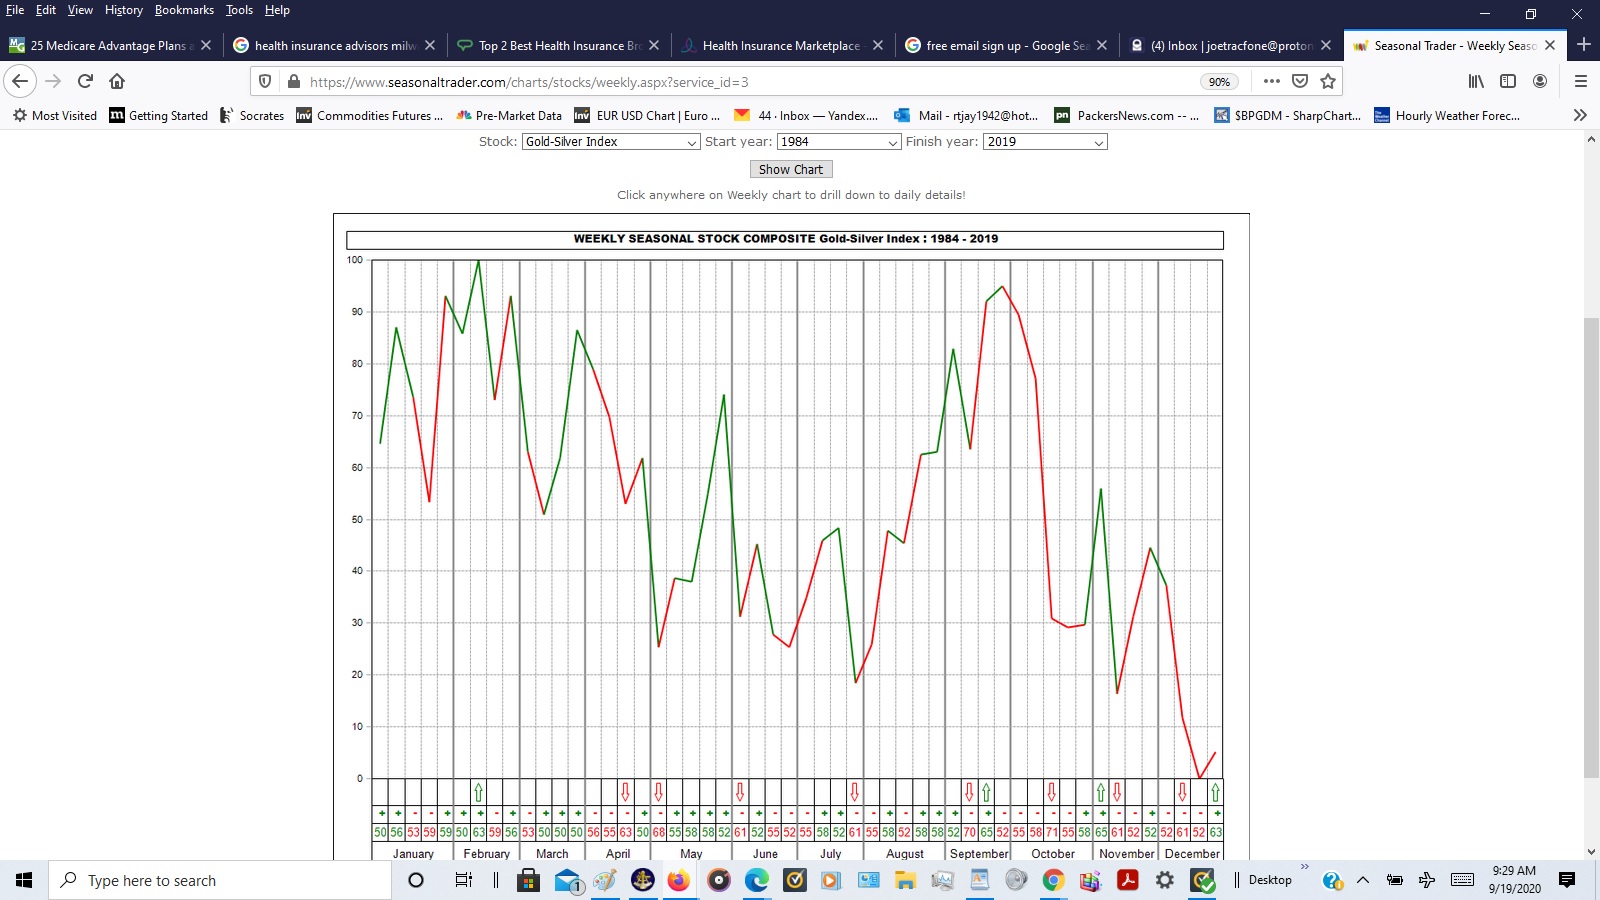
xau seasonal chart & gold presidential yearly chart
below is the seasonal chart for the xau and at the end of september into the end of october (election early nov) it doesn’t look good
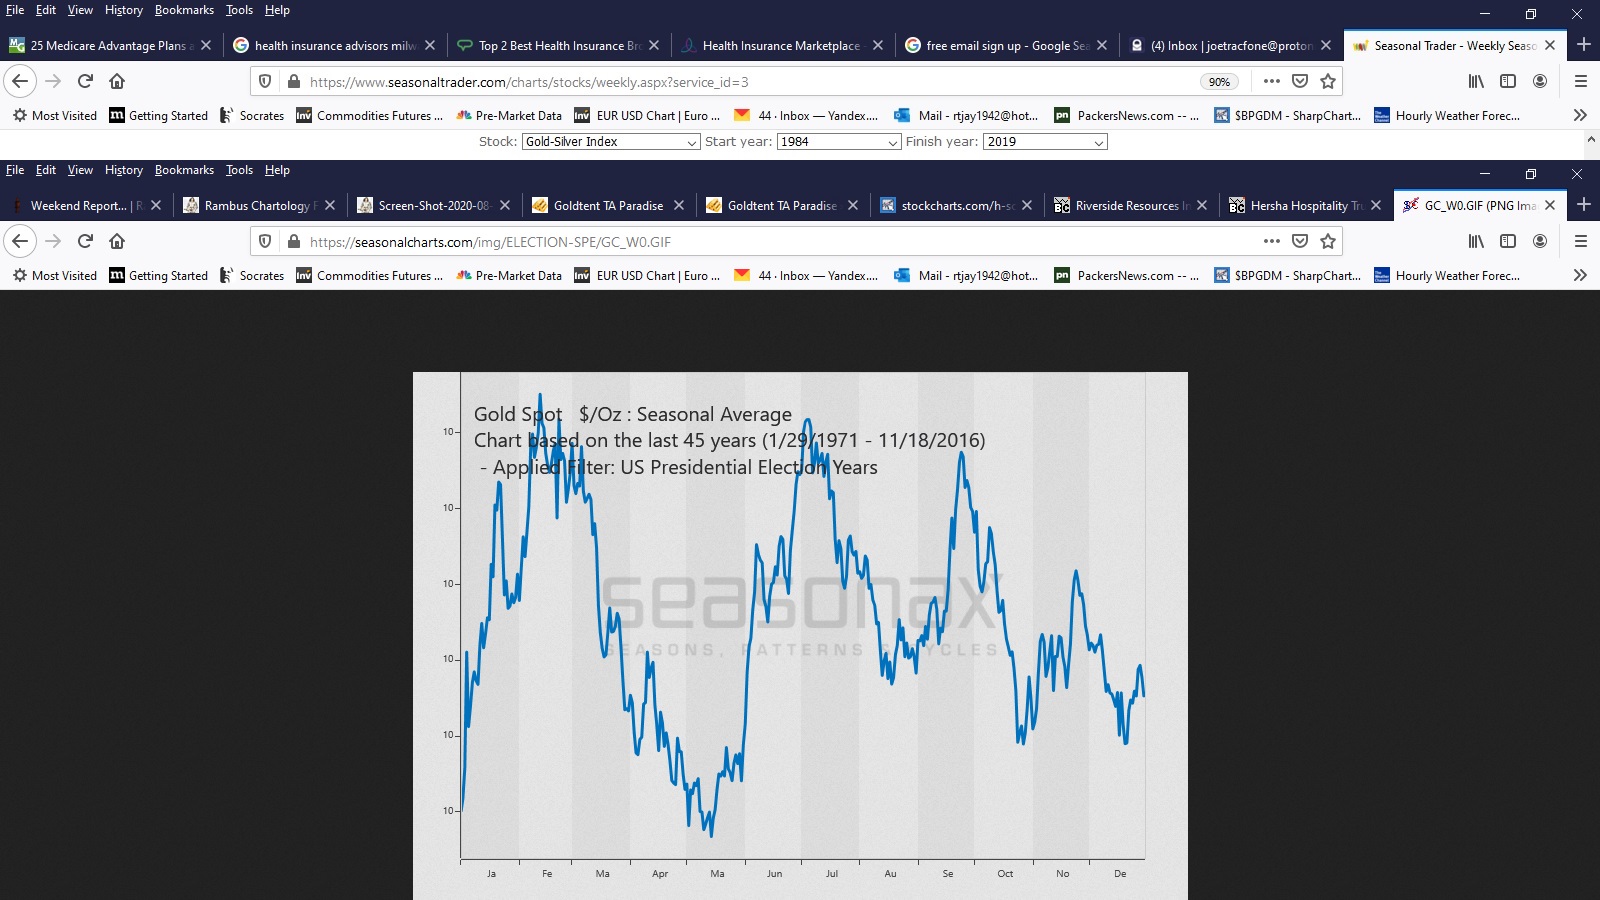
below is the gold chart for the presidential years from 1971 – 2016 (12 years)
here is a link to the graph below
https://seasonalcharts.com/img/ELECTION-SPE/GC_W0.GIF