US Dollar : Japanese Yen
Sir Patrick
Your chart can be interpreted a different way with with Classic Chartology.
I see a potential Half way Pennant working on its 6th reversal.
I see it potentially breaking out and starting a new impulse leg
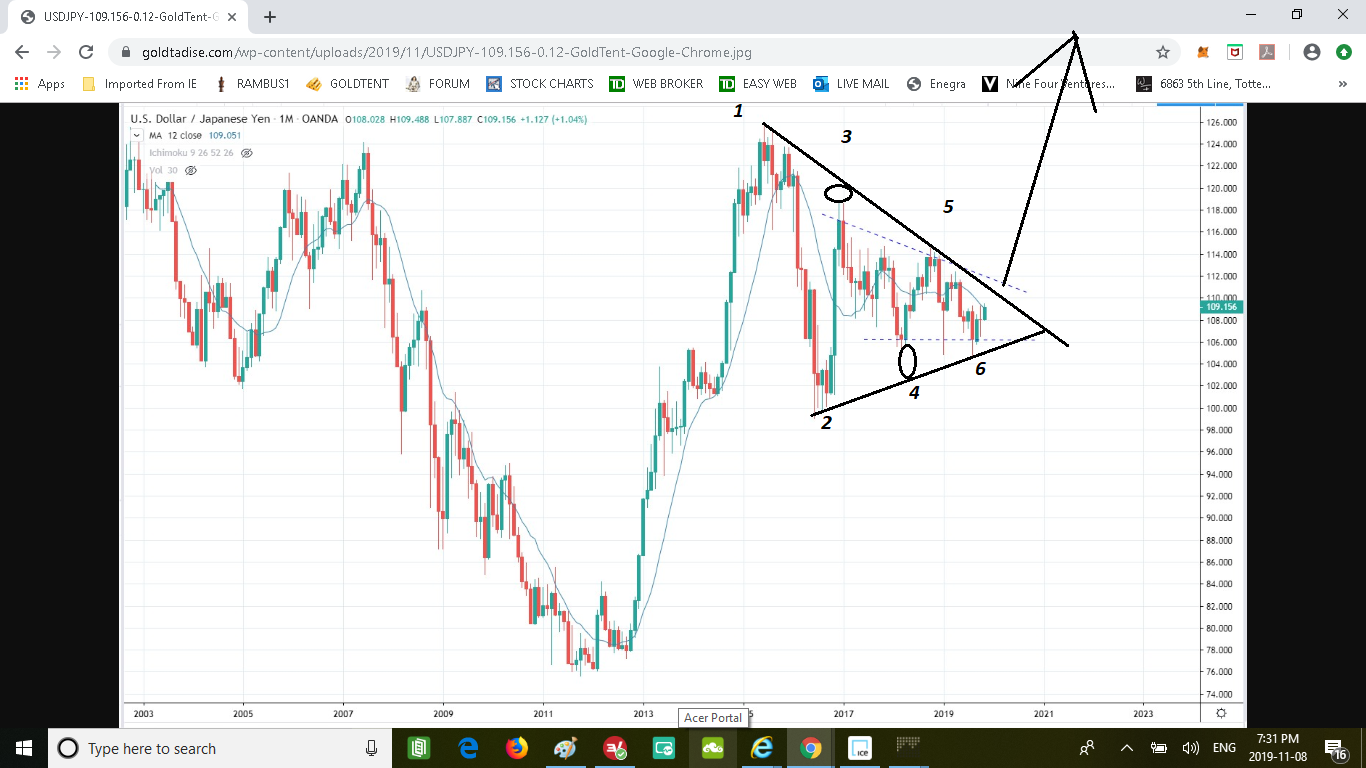
Note the 6 point pattern has 2 symmetrical “failures”
Where the reversals don’t quite make it to either line. noted by black circles
The fact there are 2 ( one upper and one lower) reinforces this pattern’s validity.
This is a nuance often seen in Rambus Charts.
The Chart can also be interpreted as a potential H and S Botton and a Cup and handle
All bullish …Yikes
So…I see the bull move still dominant.
Hope you are right and the pattern breaks down.
Fundamentally
When the Yen is strengthening vs the dollar its risk off ( DOWN on THIS CHART)..and Gold benefits but when it is dropping vs the dollar ( UP on THIS CHART) its risk on…and the stock markets tend to benefit.
Big players Borrow ( Sell) Yen and buy Risk assets. The Yen carry trade.
Maybe we are in a risk on phase …maybe there’s a trade deal looming and that is being priced in.
If you are a Goldophile it is concerning that stock markets are breaking OUT .
Rambus just posted a ton of charts clearly showing this.
I have a basic rule. If 12 month MA declining, NEVER go long. I want a close above a horiztonal breakline, above an incling 12 month MA. So, until the the price action reamins above the declining MA… that it eventually starts flattening out.. and then starts inclining… probabilities are greated we continue down then reverse up. It’s just soo much more work to get there from here. 1 one year moving in average is HEAVY and noised reduced and we are soo much closer to breakdown line than breakout line. I’ll change my tune when we start challenging the upper boundary of the desecnding triangle. You are correct, it’s good to know the 2 possible outcomes and be prepared for both.
Thanks for explaining you method Patrick.
I see the price action has been alternating above and below your 12 month MA during this consolidation
but it is below at the moment.
Always interesting