USD breakout BT?
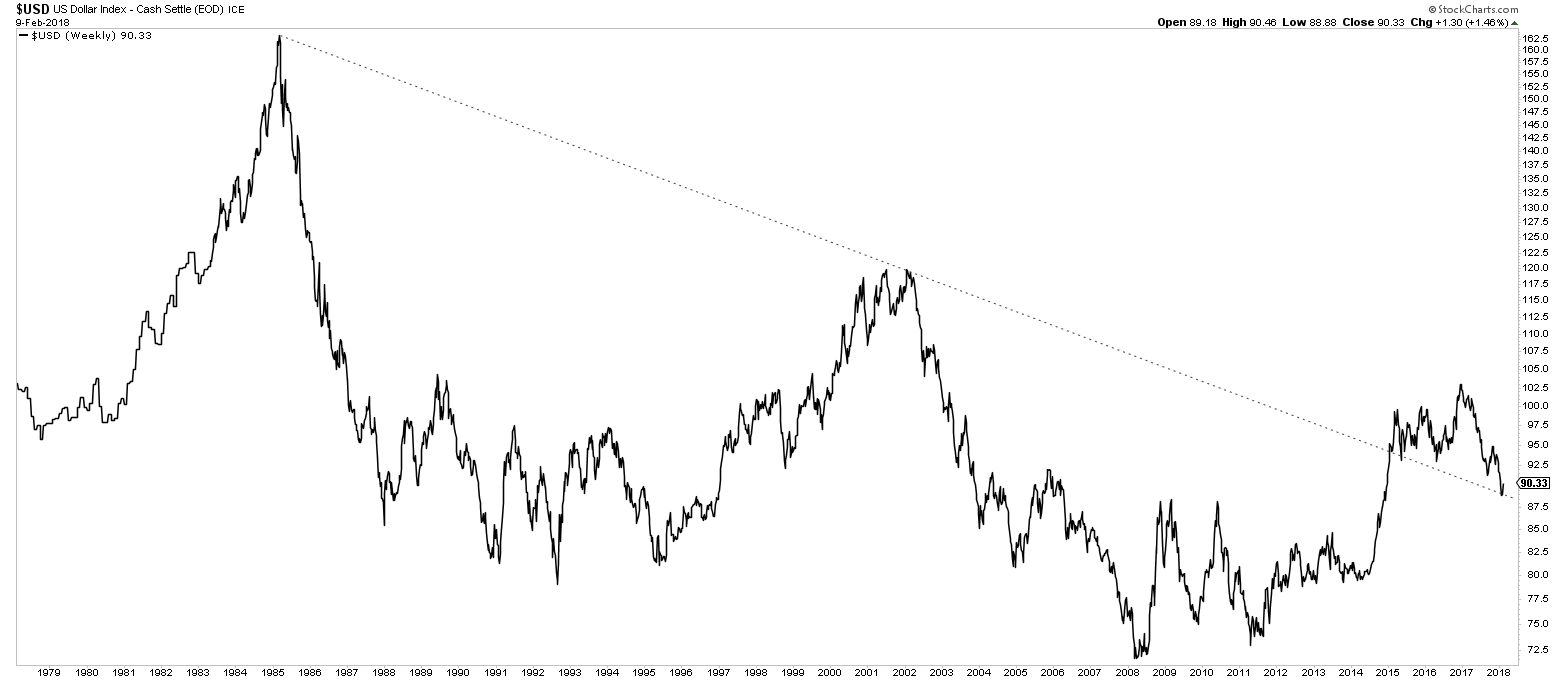
USD seems to be popular among chartists nowadays and this chart will present nothing new in itself. But looking at this long term chart I see that the breakout from 2015 finally is about to complete its backtest. This means that we finally, about two years after the breakout of the long bearish trend line, will be able to tell if the breakout was valid or if it was a false breakout.
The current price action is obviously bearish but surely, it will be interesting to see if the old trend line will provide support or not. And now seems to be the time.
Zooming in, there is initial resistance roughly in the 91-95 zone.
Good chart Pixie
I about forgot this chart.
Important for sure.
Up a little more, down, up again, then probably down quite a lot.
I think.
There is resistance very close above current price so your scenario seems quite possible.