NYSE Monthly
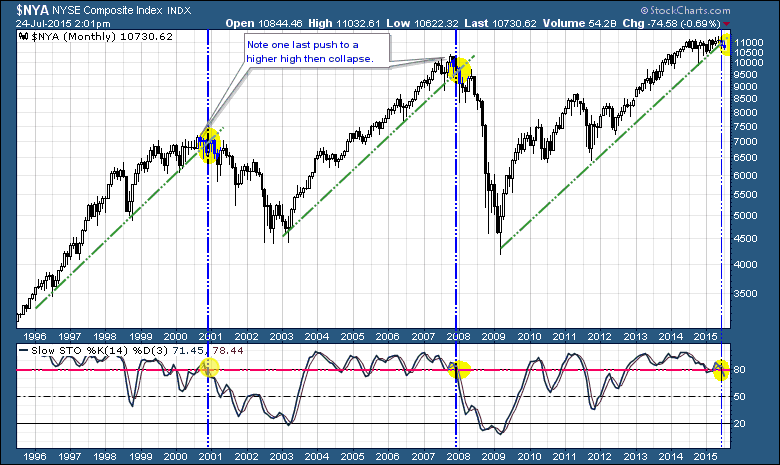
Here is a chart I’ve been following for about 9 months now that I use to help assess whether the trend is rolling over. We have a sell signal this month so far. Note that my three green trendlines all have the exact same slope. I know I’m positioned accordingly in my long term accounts.
Great chart, Mark.
Looks bearish. I’ve been saying for a while that it’s about time for the stock market to go nighty night. So do you really think the Fed is going to be dumb enough to start tightening in September, especially with commodities circling the toilet bowl? All I know is if I was Janet Yellen there’s no way in heck I’d raise interest rates at this point. If they do, they’re asking for big trouble. Like 2008 on steroids trouble.