FARMER’S SILVER ANALYSIS
WOW…I just got back to the Post and I see it is a Humdinger to say the least
Farmer you second chart along with your explanation of this methodology is a YIKES
Then Marcusjames asks Groc for the Polite Analysis and it strongly concurs in the polite form and really really strongly concurs in the Profane analysis…triple yikes and sheesh squared
Thats incredible…what an amazing thing we have here
You have me concerned enough to be going to the Coin Shop Tomorrow and selling a chunk of my stash !!
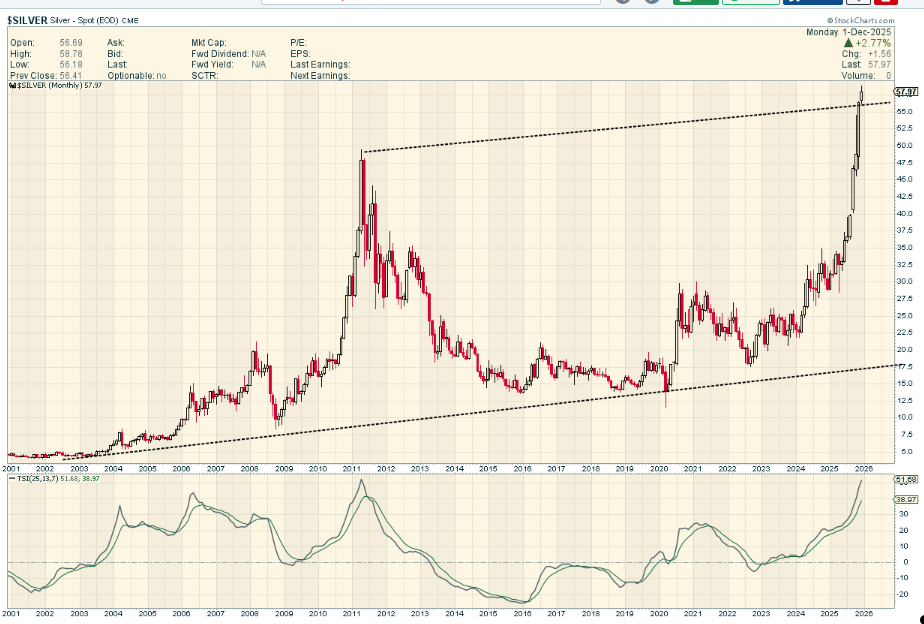
Having said that I am posting the Stockcharts version of your monthly 25 year chart
The way I see the bottom line and then drawing the PARALLEL top line carefully..we already have an overthrow or perhaps a breakout ? I don’t know how to do the Gartley thing though
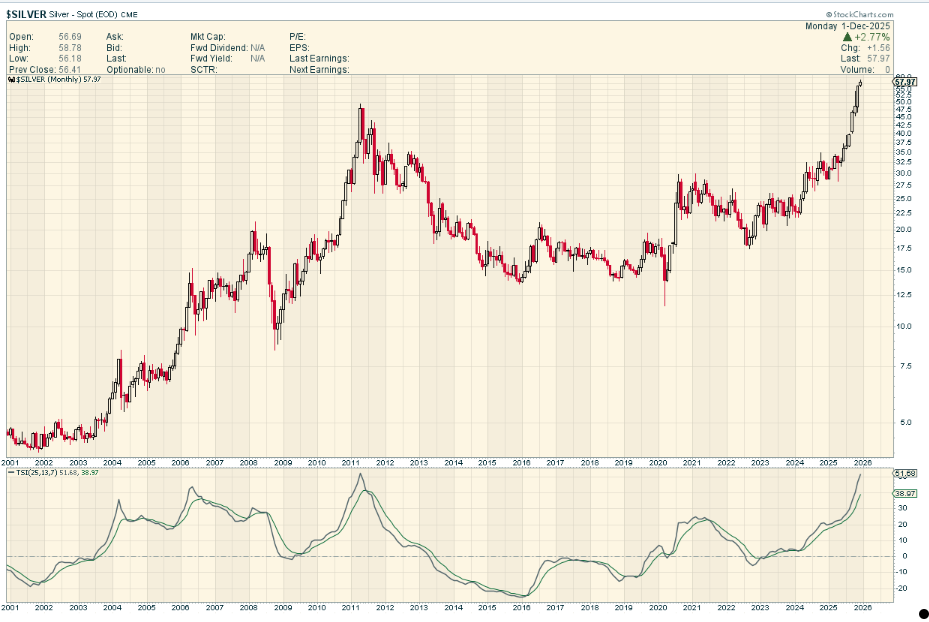
Then I am posting the LOG Scale Silver 25 Monthly to compare
The Log Scale on a 25 year timeframe is Usually preferred as it captures the % movements as opposed to Linear which can be misleading
I am not doing this to dispute your Carefully thought out and presented Chart …Just trying to add to the debate
Comments Appreciated
Linear
Log
I think we should just keep it simple. The trend is up until it’s not.
That being said, Silver goes straight up at the end of a move. It’s done that and gold hasn’t made a new high. Stocks aren’t really following convincingly. Just some cause for pause.
Regardless this is NOT the end of the bull market. This is NOT phase iii. This is the hardest part or phase 2. But we are due a huge cleansing of sentiment and this can be healthy going forward. Time to have a fire sale in the weeks and months ahead? Who knows…
got some divergence on the gold stocks 20 ma , obscure indicator but does have merit
https://www.tradingview.com/x/LP6wtLfu/
Thanks Fully. I am really pleased to hear my silver analysis has moved you to action. I have a hit on my hands with that recent post. Wow! For the record though I think silver will be going up to 100 dollars so maybe think twice before selling off your hoard. What will happen here is just a strong pullback but it will not last forever.