With Silver, More thinking – Less Propaganda
Right to the point …. I am just going to show you a chart that will give you pause on your silver buying. You need to assess it for yourself of course. But after what has just happened with price shooting skyward so rapidly, do you really see that following up again anytime soon?
Well I was one of those who did. It was just days ago I assessed silver and noted that according to my modeling this current correction was just a pullback from a much larger degree rise. And don’t worry your shaggy little head over it. What I did not comment on was WHEN the price resumption would begin. I even had myself fooled. I was just looking eagerly for the next entry instead of parsing the charts and thinking harder. In other words, I was falling for the usual metals propaganda which just never ends.
That’s a story for another day though. For now, look at where price hit its peak. Silver rose to its exact resistance level based on the 2011 high. So clever. I don’t know why I never noticed this the whole time price was running up. Had I drawn this chart then I would have boldly invested right up to the last minute and then sold with confidence when the top was in. Alas, I did not see this connection until tonight.
So I am still mortal. lol
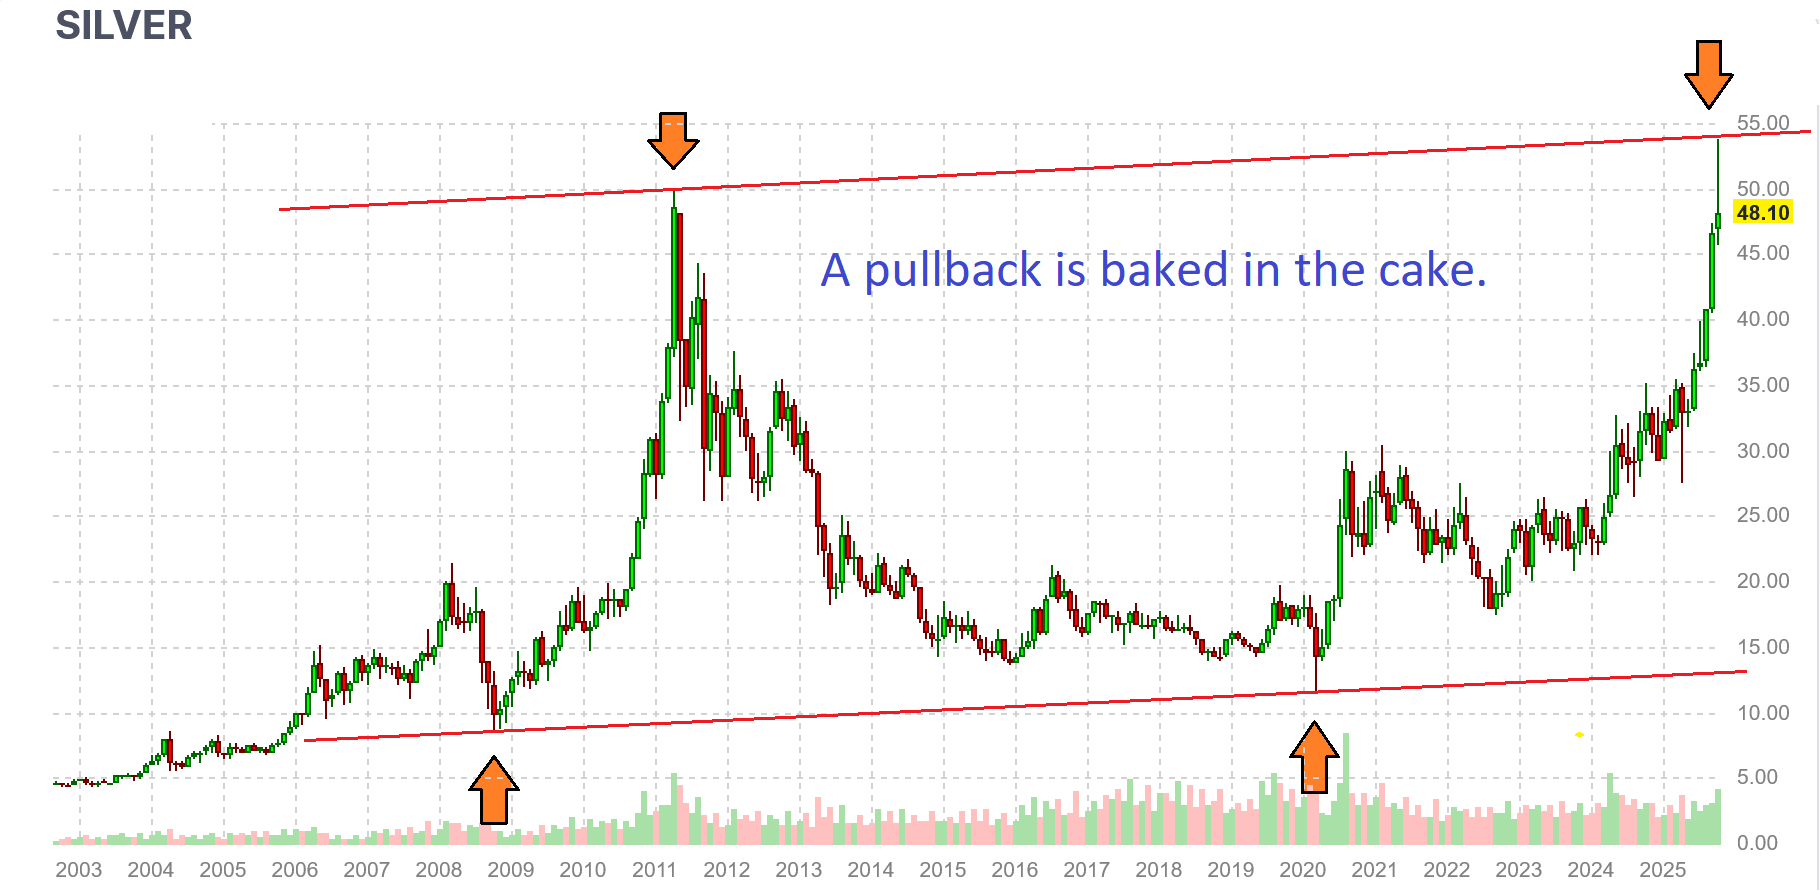
Compelling chart Sir farmer
Indeed. Which is why its crickets from the site. Everyone’s eyes got opened at the exact same moment of realization.
Even using fake government statistics, the USD has lost 30% of its purchasing power since 2011.
According to Shadow Stats, about 75%.
So taking a 50% loss in purchasing power, silver is really selling for about half of its 2011 price!
Something to keep in mind!
My commentary and chart up above were technically oriented. Nothing to do with value or comparatives to other currencies. Therefore the chart does not tell us how much higher silver can go once its ready to move again. Maybe it will be to 200 dollars! I do not know. All I wanted to point out was that price stopped dead with precision inside the parallel channel and that the price reversal will therefore be more certain and of longer duration than we first suspected.
I’m looking at the log and inflation adjusted charts instead – no worries.
https://www.macrotrends.net/1470/historical-silver-prices-100-year-chart.
Not to get too far off topic but my take is OIL is where the value is.
Silver Oil Ratio
https://www.macrotrends.net/2612/silver-to-oil-ratio-historical-chart
Inflation Adjusted oil.
https://www.macrotrends.net/1369/crude-oil-price-history-chart
Since 2022 PM’s have risen dramatically against the dollar while OIL is FALLING against the dollar – where does the pricing anomaly lay? Where is the value opportunity? There is a lot of chatter (Doomberg and others) that DEMAND for OIL as an energy source is diminishing because of alternative fuels, tarriff manipulation and yet untapped reserves. Peak prosperity on the other hand is arguing the SUPPLY of oil is diminishing (while still viable, fracking as an energy source, has peaked). Electricity is a derivative power source, maybe markets have forgotten that.
Chris Martins
https://peakprosperity.com/the-biggest-untold-story-of-2025/
Debate
https://adamtaggart.substack.com/p/the-great-peak-cheap-oil-debate-doomberg
Doomberg
https://www.youtube.com/watch?v=RkHusA154Ng
Back to 15…
Ps: Having to use a VPN these days to access the site. Someone doesnt want people ITK.