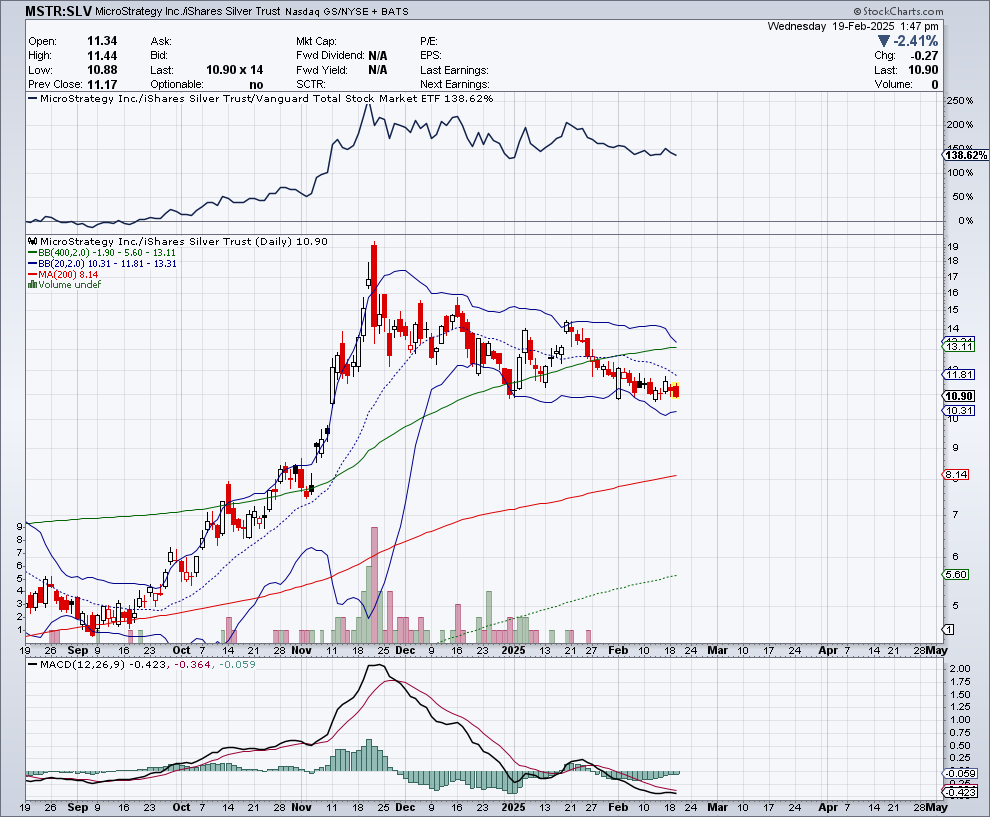
Microstrategy:SLV about to gap down and leave an “island top?”
Let’s see. It fits with the notion of an imminent impulsive move higher in silver. The presumptive double top is symmetric in terms of time right about now (about 7 weeks from trough to trough for the first peak and it’s been about 7 weeks for the second top now) FWIW. The ratio has already been almost cut in half since the peak. Crazy!
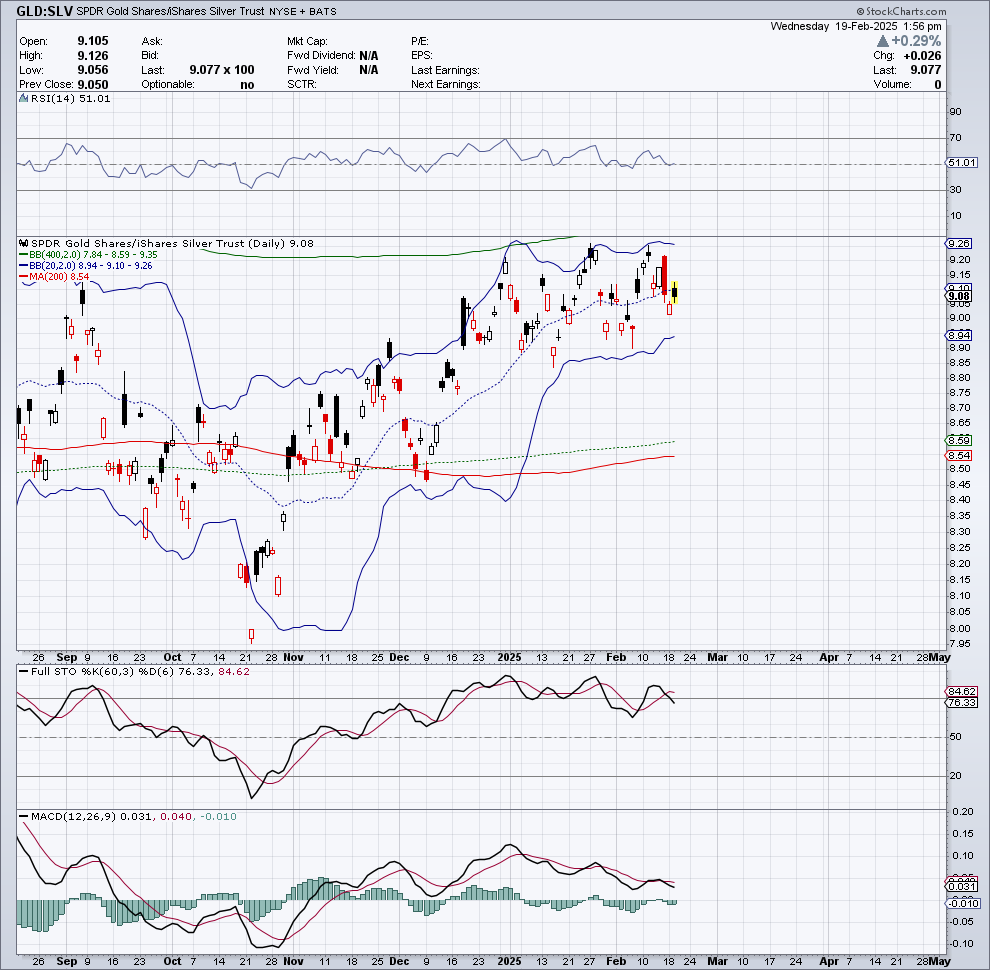
I’ll also note that the gold:silver daily chart looks a bit tired. It’s been trading in a narrow range now for a couple of months, and the stochastics (60,3,6) have been overbought and elevated for quite some time (see “Full STO” graph below) and are overdue for a correction back to oversold levels, even if the ratio is ultimately going higher in the months ahead (let’s hope not). There are no guarantees with these momentum indicators, as overbought can remain overbought for extended periods of time, but they have been stuck here for quite some time and are overdue based on historical action. At a minimum, I would be very surprised if gold just takes off vs silver (or crashes less than silver) as of today based on this chart.
Interesting concept. What are the origins or thoughts behind this ratio chart?
Anyhow, I only have MSTX and SMST on my setup.
Certainly no ratio to SLV.
In any event, mostly sideways for both MSTX and SMST for months now.
No idea which way it breaks on T/A grounds here.
From what I’ve read though, Saylor’s financing arm suggests a ponxi.
There’s not much in it other than to point out the extreme valuation of MSTR as well as the potential for a major double top.