Silver Real Deal or Hard Backtest Last Hoorah?
I can’t answer that question. I can only show some charts.
First chart is silver log scale chart on stockcharts: Backtest comes in slightly above $17.
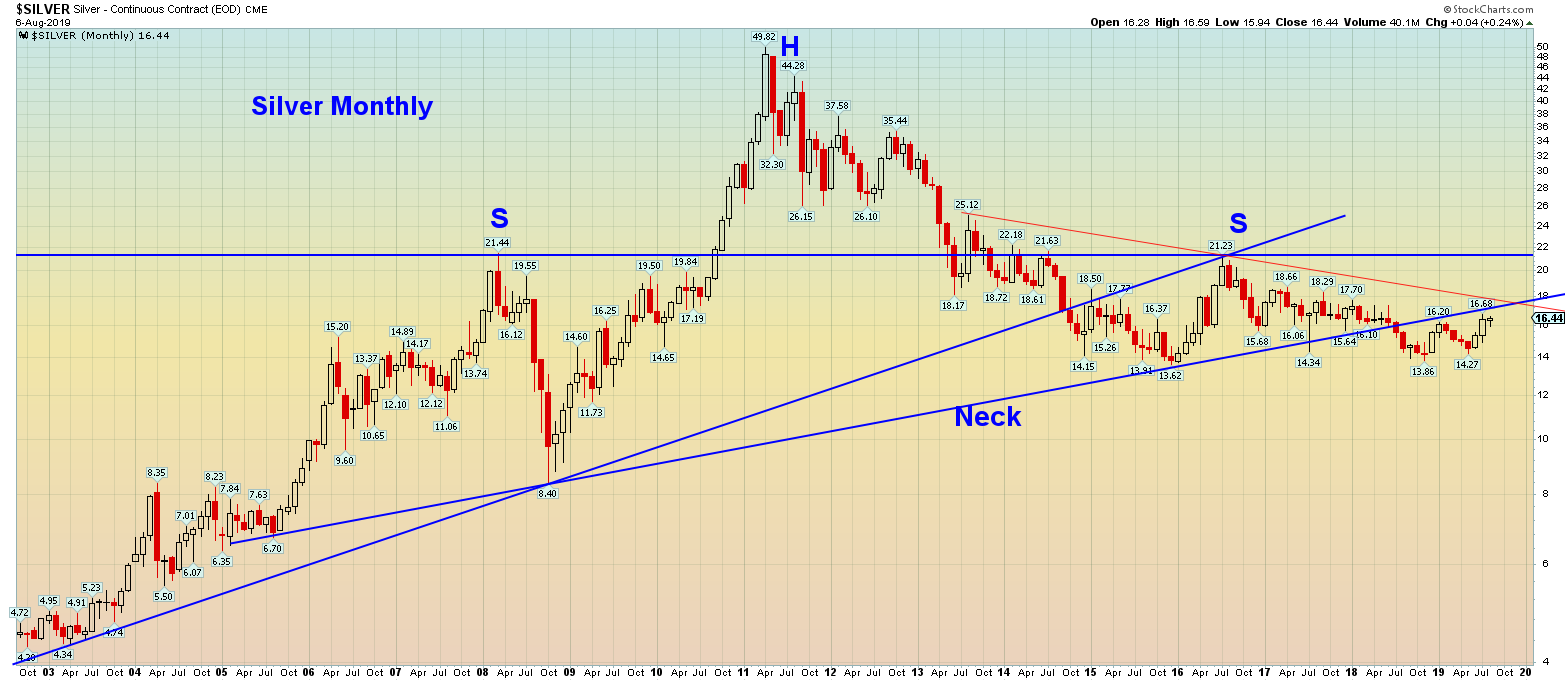
Since I’m a bear still on silver you can shoot me because I had to show that one first. It’s the only thing I can hang my hat on where silver is below the neck. Also, the gold:silver ratio is still above the breakout line which still seems bearish silver.
Now for some charts to give you bulls some happiness and me some wondering if my current “bearish silver” thesis is wrong:
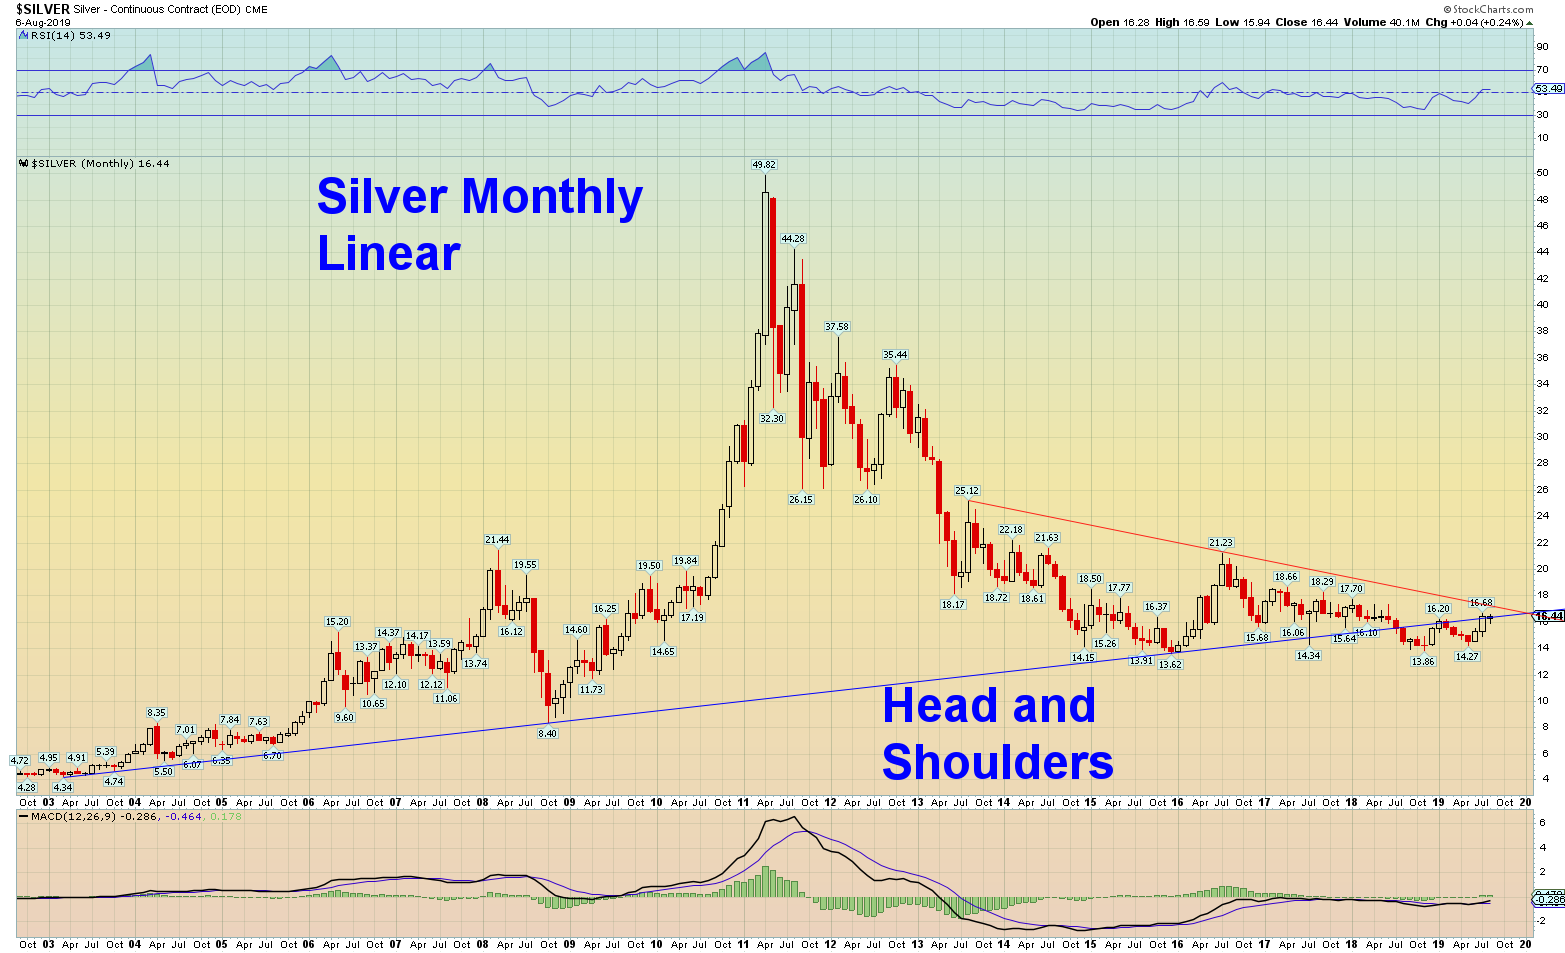
Silver Monthly linear from stockcharts above. Silver, at $16.90, is clearly above the neck but below the red line which is important for the bulls.
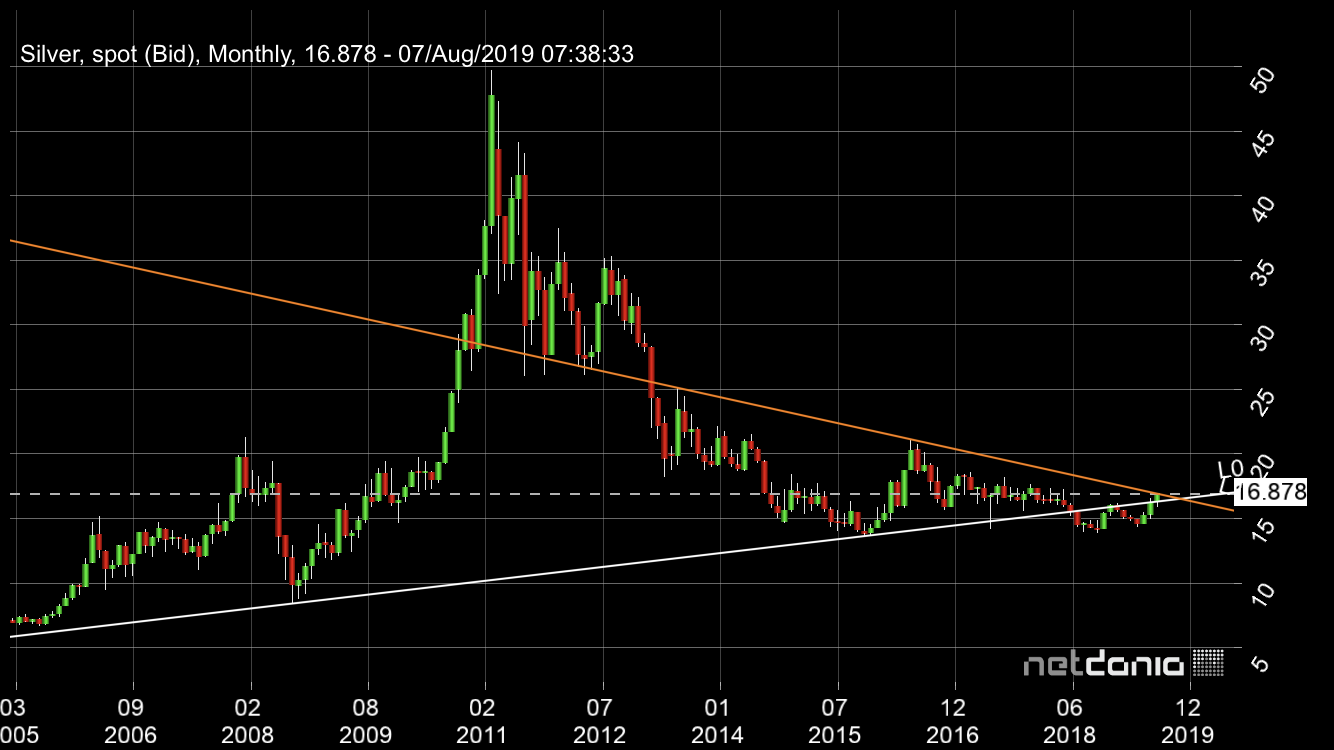
Now for a Silver Monthly linear from NetDania which is above the neck and testing the red line. First is zoomed out. Second zoomed in:
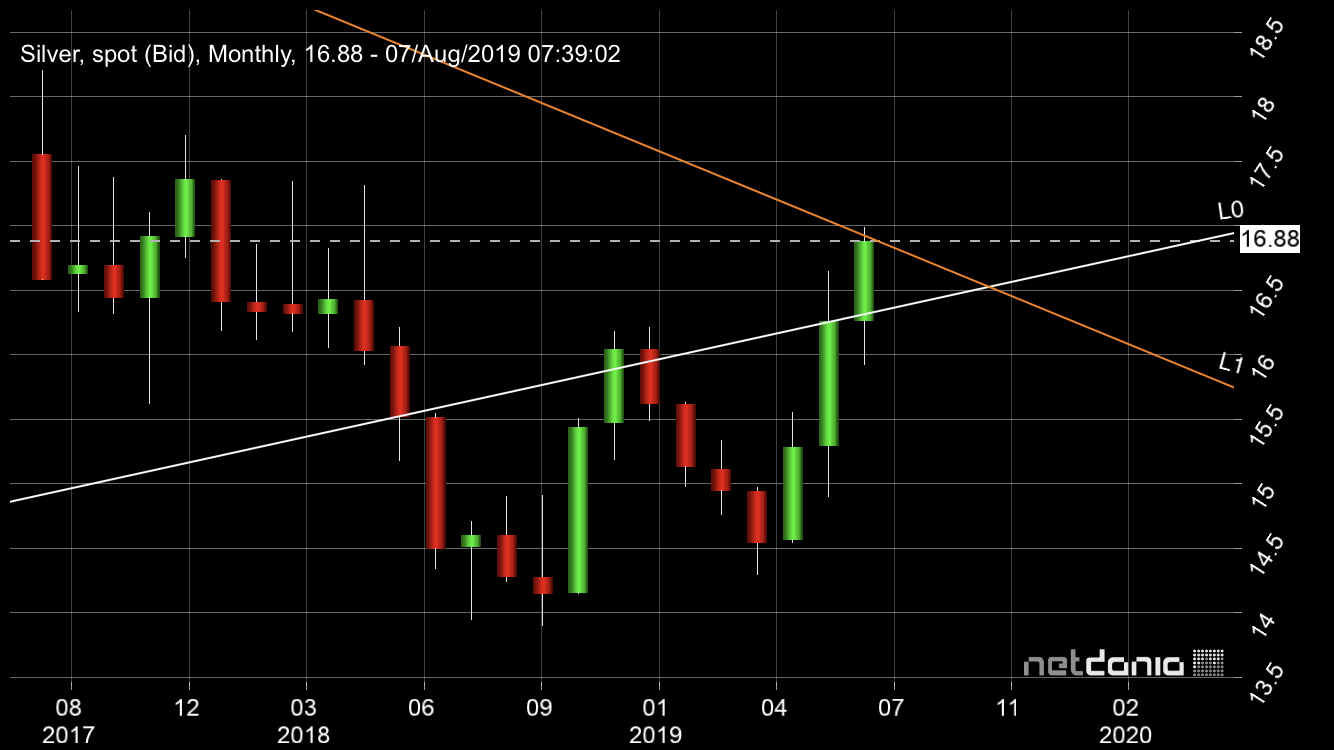
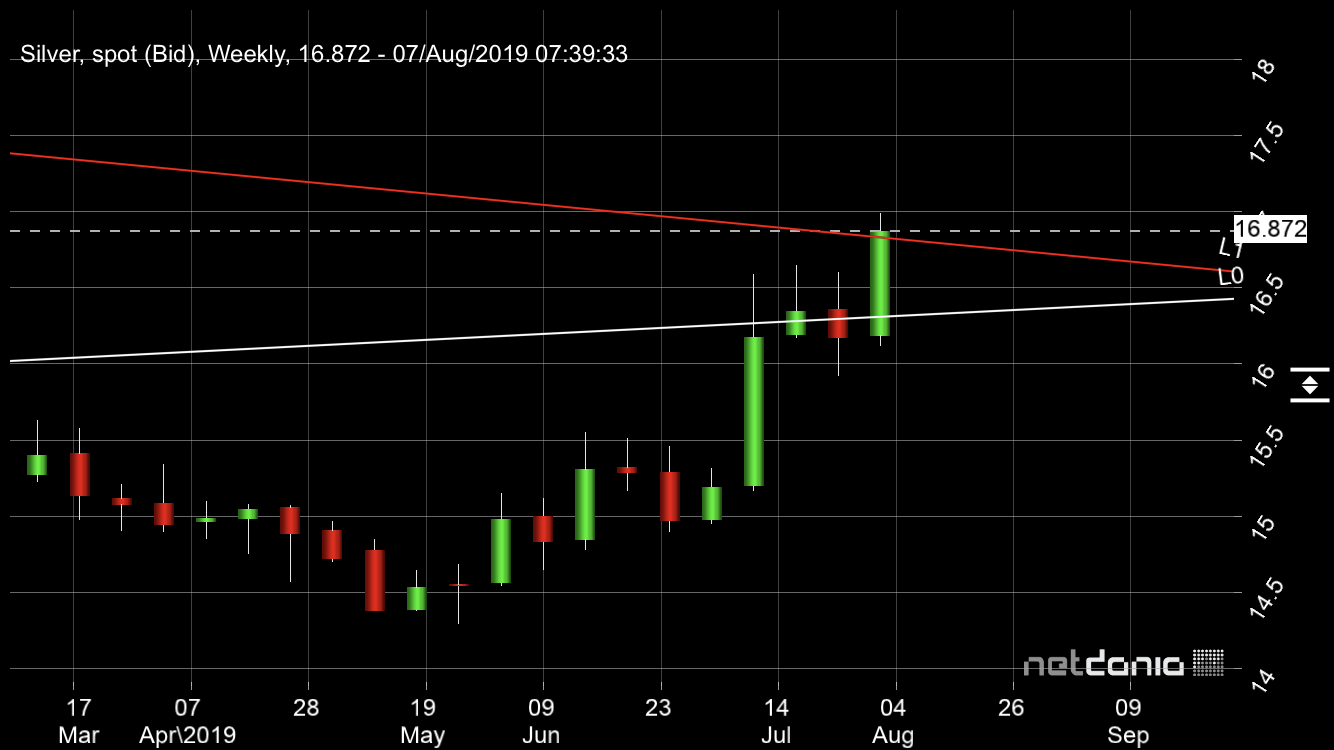
Silver weekly linear from NetDania is the most bullish. Silver is slightly above both important lines on the weekly as seen on this zoomed in chart:
Good luck silver bulls! Frankly though, I gotta see it close above to really believe it…
I love your charts however I will have to respectfully disagree with you that silver is gonna crash – the head and shoulders chart if it were to play out would have silver at -20 dollars so I think it’s not a valid chart –
If any one knows or has any charts showing such a chart playing out please let me know – would love to see how it plays outb
You have to look at logarithmic charts and do percentage drops to get a target. Would be around $7 silver not -20 which is obviously impossible.
Actually just looked. Would be about $4 target if fall starts in next couple months.
Chuck were you around 2003-2011? If you aren’t on board the Silver freight train you’re going to be obliterated. Per one of my favorite Gene Wilder and Richard Pryor movies, “The bull is more dangerous than a freight train, a freight train won’t back up and finish the job!”. This is a story you will be able to tell for the rest of your life.
Was long everything PM early 2004 until 2012. Ugh… Finally found Rambus. More enlightened now.
Chuck, for what it’s worth I’m with you re silver. Miners and silver have not exceeded the 2016 tops.
I told you this a while back … Mike Oliver has silver breaking out on long-term structural momentum … it triggered over a month ago.
Leave your price chart behind, his momentum structural analysis is superior. Price will (is) following his momentum oscillator breakout. It’s your choice if you want to miss this tremendous opportunity.
Long gold seems right now. Silver I want to wait till 17.50-18. Is that too late?
You’re good … just highlighting what I’ve observed since I began following MSA. Good luck.
Thanks. You too. Seems like we may be on the precipice of something big.
PC, my e-mail is afasilver15@yahoo.com … send me a note and I will send you a few things to consider.
Broken out now. Looks like the real deal.