Gold: Are we there yet II?
The odds indicate that we are. Surf City’s cycle work offers one reason and my friend’s work offers a completely different one.
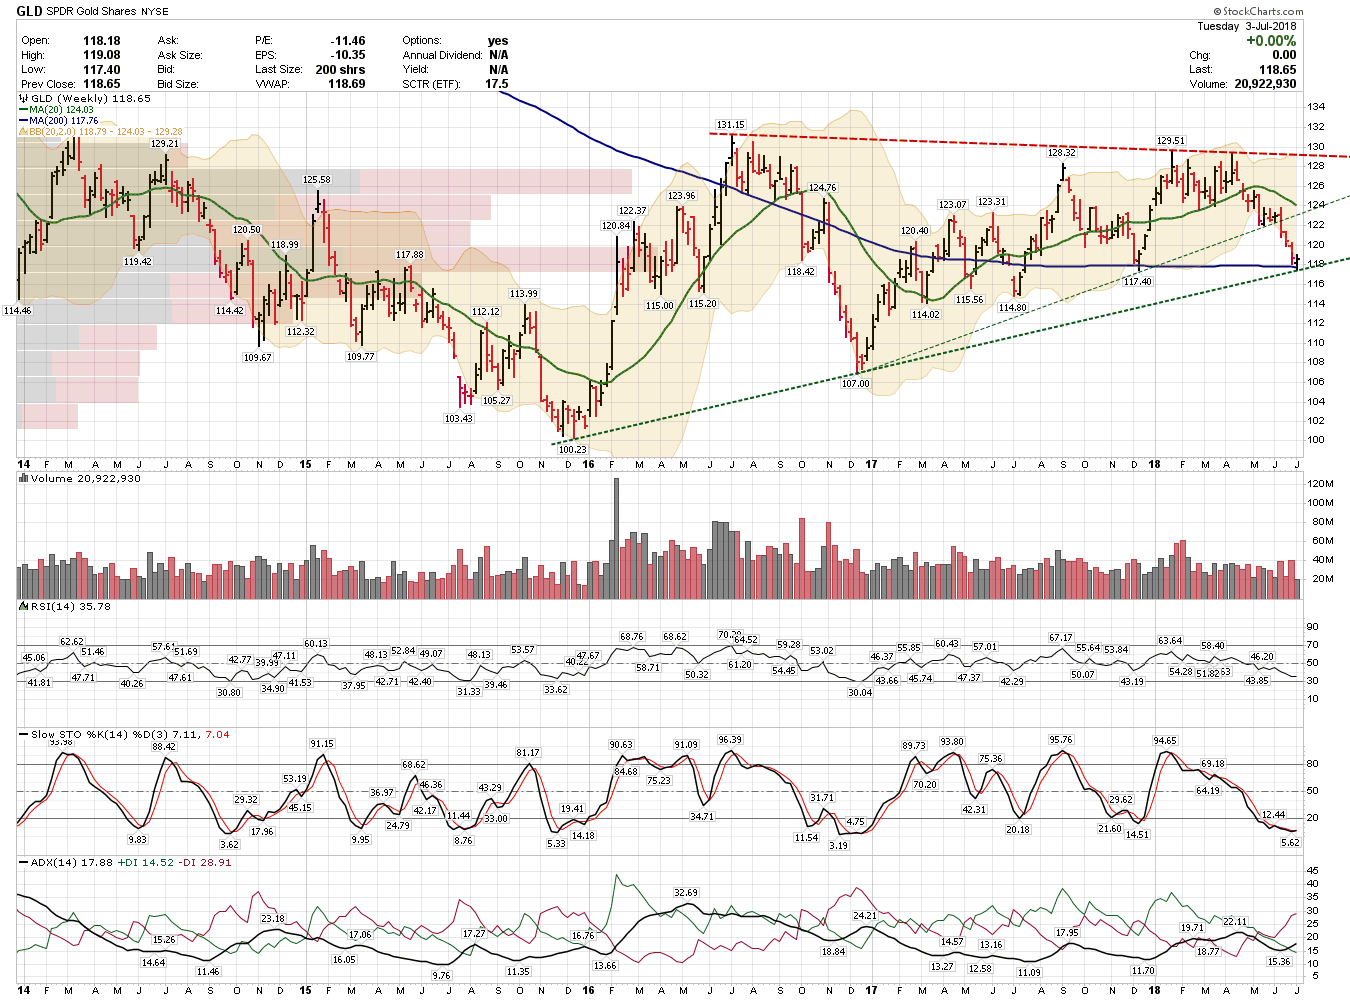
The GLD weekly chart indicates the 200-day SMA is also a good place for at least a bounce – even if we don’t finally bottom out until $1,125 or therabouts. The market will soon make it clear which area will be the low.
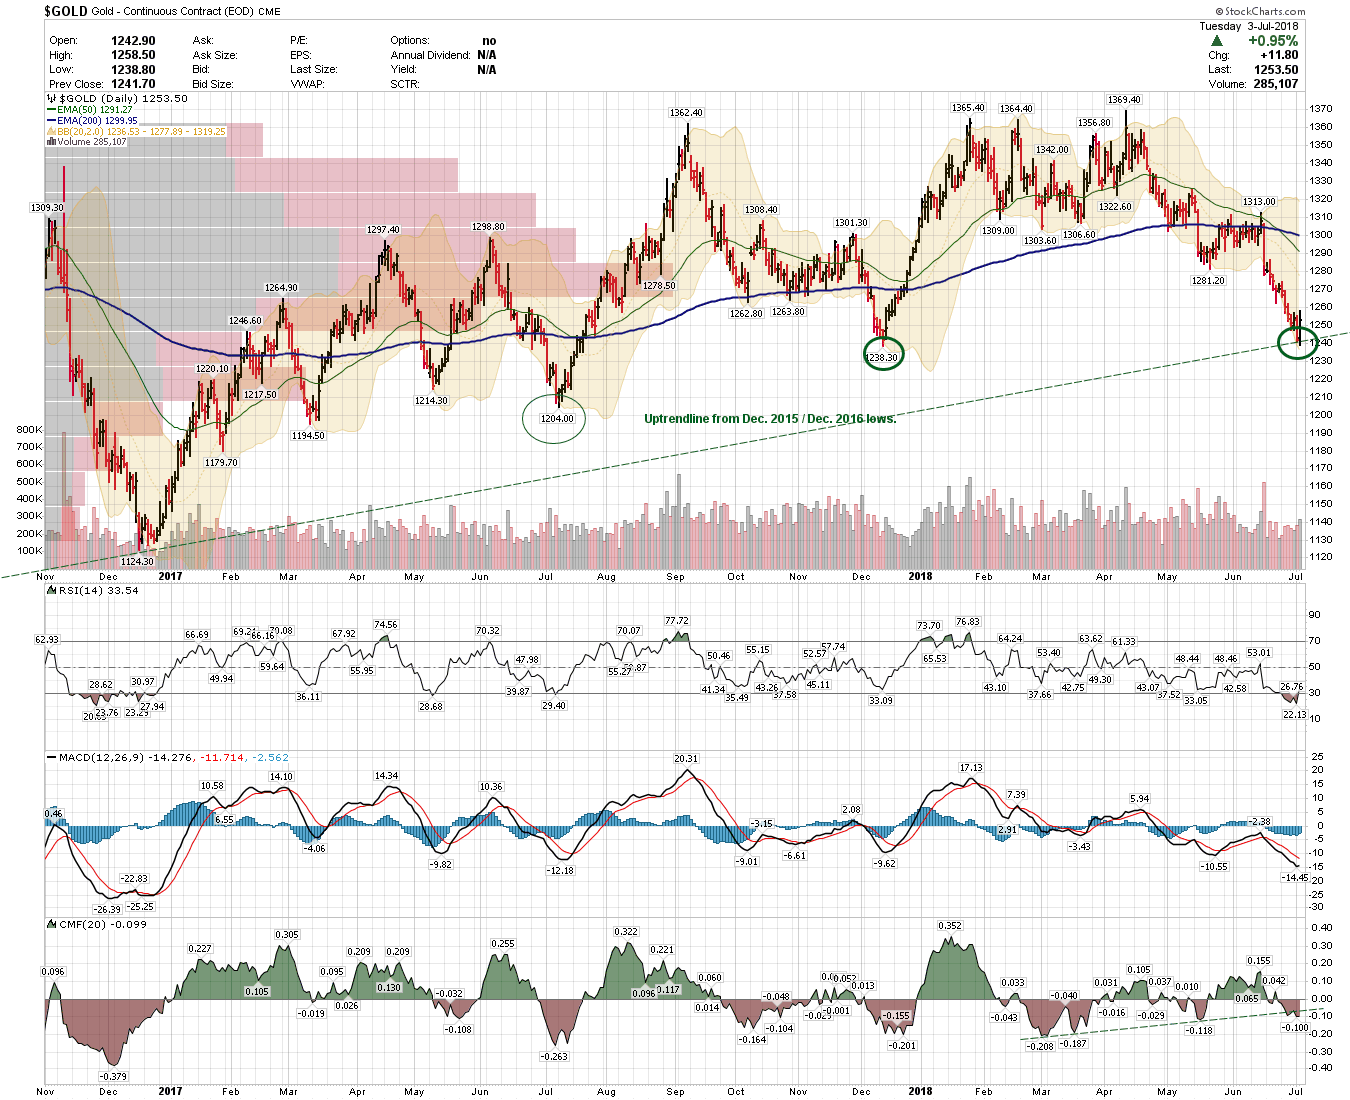
Below is a daily continuation bar chart of Comex Gold. Notice that unlike recent bottoms this time the 50-day EMA is BELOW the 200-day EMA. The last time these Exponential Moving Averages were in this same position (right after the 2016 US election) gold had another $34.30 to fall before finally bottoming at $1,124.30. The equivalent today would mean another decline to $1,204.50. It’s my opinion that if Norvast is correct and the US Dollar hasn’t yet topped, this could well happen. Even if it does, a large rally should then take place – probably between $125 to $155/oz.
This was published yesterday. I intended to post it last night but we were traveling.
https://goldtadise.com/wp-content/uploads/2018/07/TechFocus-Weekly-Gold-07-03-18.pdf
Thanks Boo !
Depends what you define as there?
And what you invest in?
I follow the PM miners and only the the PM’s in decent stable geographic locations and turning a profit so maybe my perspective is different than others here at the Tent?
The question I ask is when looking at PM’s does anybody even look at the P/E P/Book P/Earnings anymore? Seriously? The bulls are expecting a bounce here in spot yet the PM’s look like it maybe priced in? What’s gonna happen next earnings? Divergence at the moment in some of the usual suspects IMO? I see value in others FWIW?
Very interesting the divergence IMO.
We are all waiting for Nirvana…a strongly rising Gold Price which floats ALL Miners ( Jan 2016 – August 2016)
“There” is a gold price low of at least intermediate degree.
“And what you invest in?” It should be obvious from the two charts displayed and the written comments that I’m talking about the price of Comex GOLD – not mining stocks.
“The bulls are expecting a bounce here in spot yet the PM’s look like it maybe priced in?”
What do you mean by “PMs”? Precious metals or mining stocks?
Appreciate your passion BooBooMan!
Precious Metals space lends too many different investment strategies for sure. May I suggest in different words that I was questioning as to the best investment scenario other than my go to – ie. being the Miners of which I only invest in proven mining plays with positive cash flow.
My comments are questions of my own investment strategy in the Miners not your interpretation of the GLD & Comex.
Thanks for the charts
Thanks, BooBoo:)