I Just Switched from Long to Short Gold
I just posted this premarket at the Rambus forum. Just copying and pasting it here now.
Sorry I’ve been gone. I’m usually all in or all out of anything I do. Kids(3rd coming in March!-Carter to join Cameron and Katie)/wife/fantasy football got my hiney all busy.
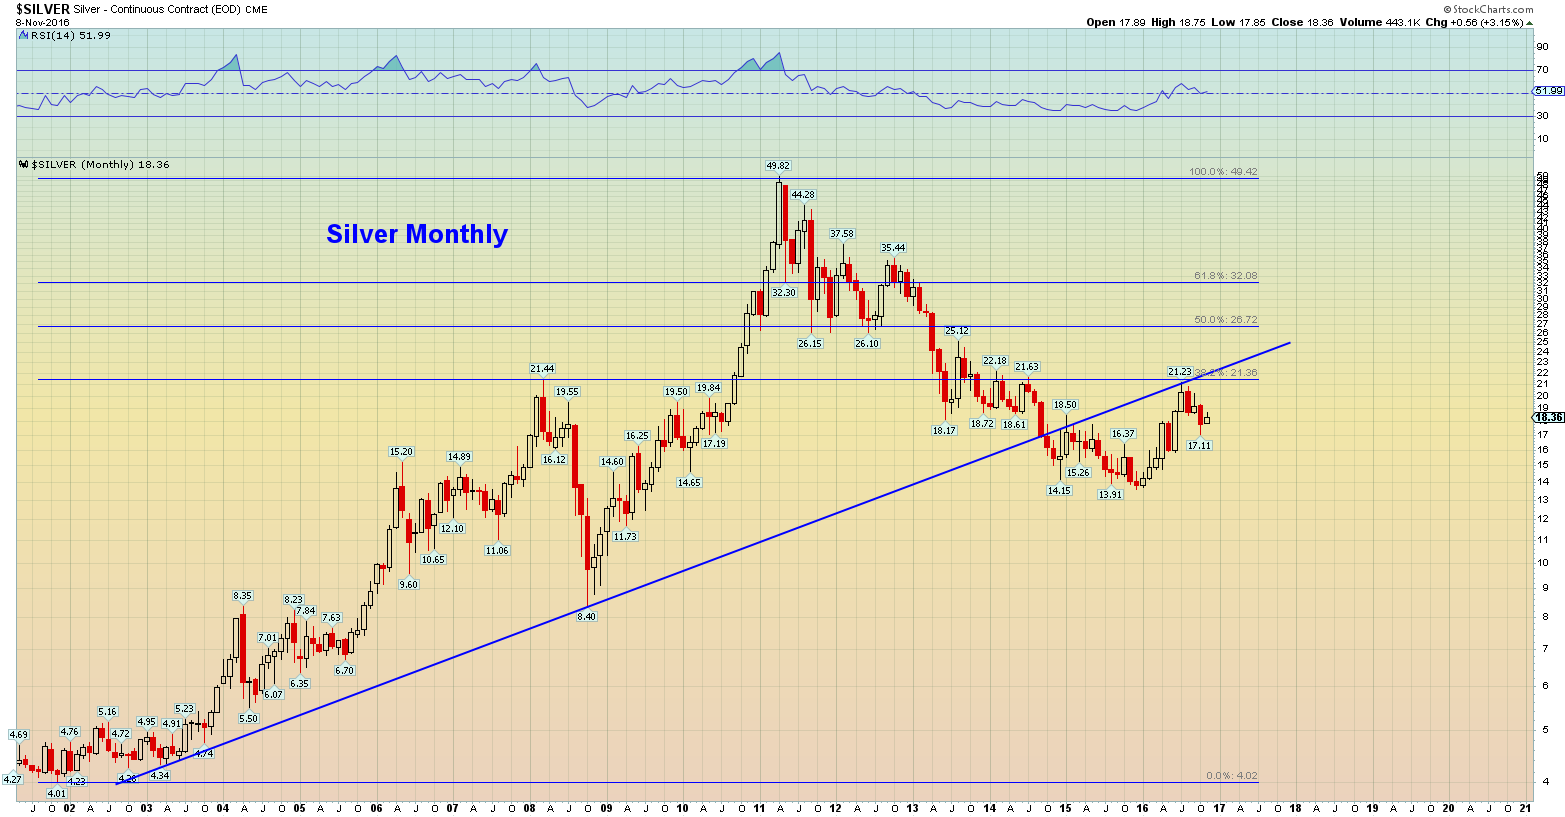
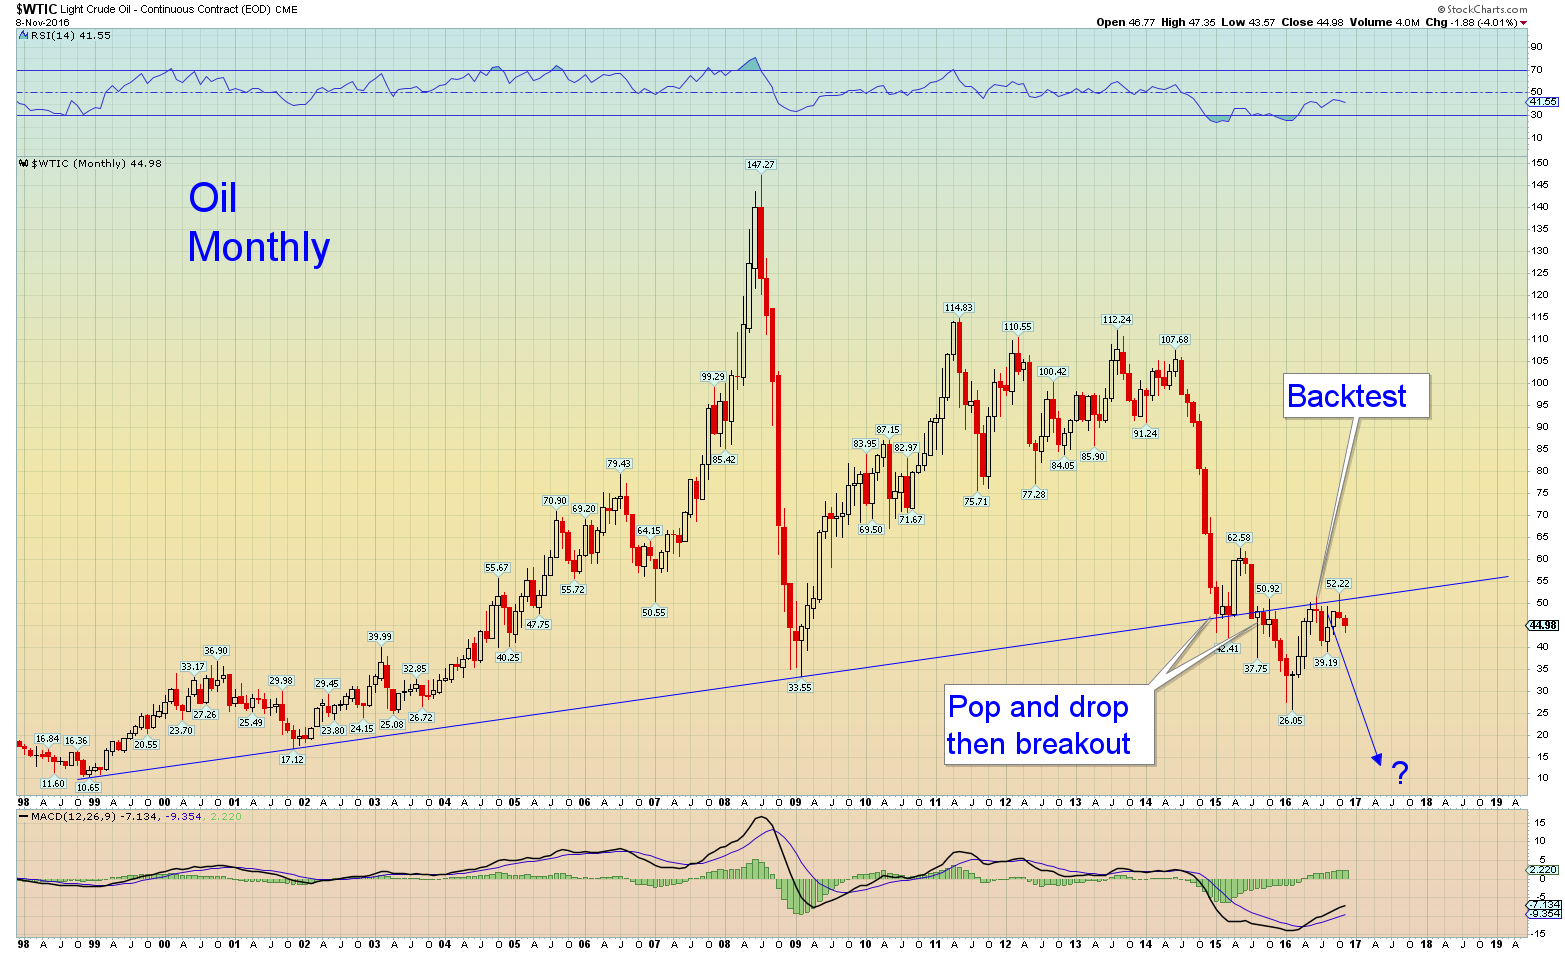
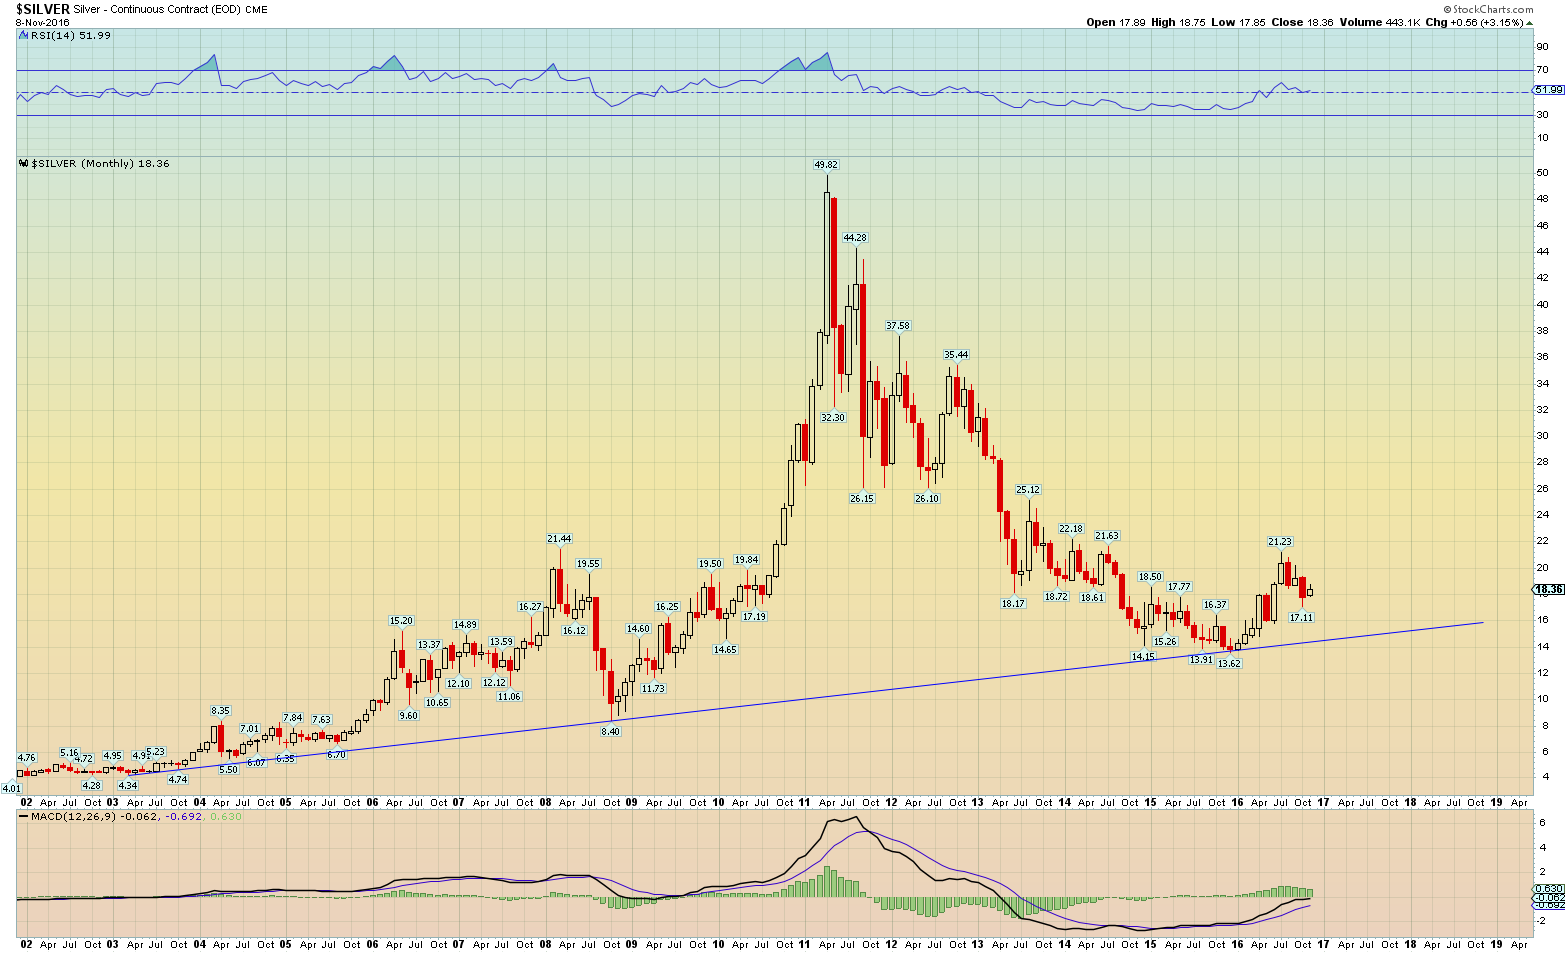
I want to point out this first chart of silver. Silver Log. Backtests the breakout down that gold and oil did. Silver linear further down looks like an H&S.
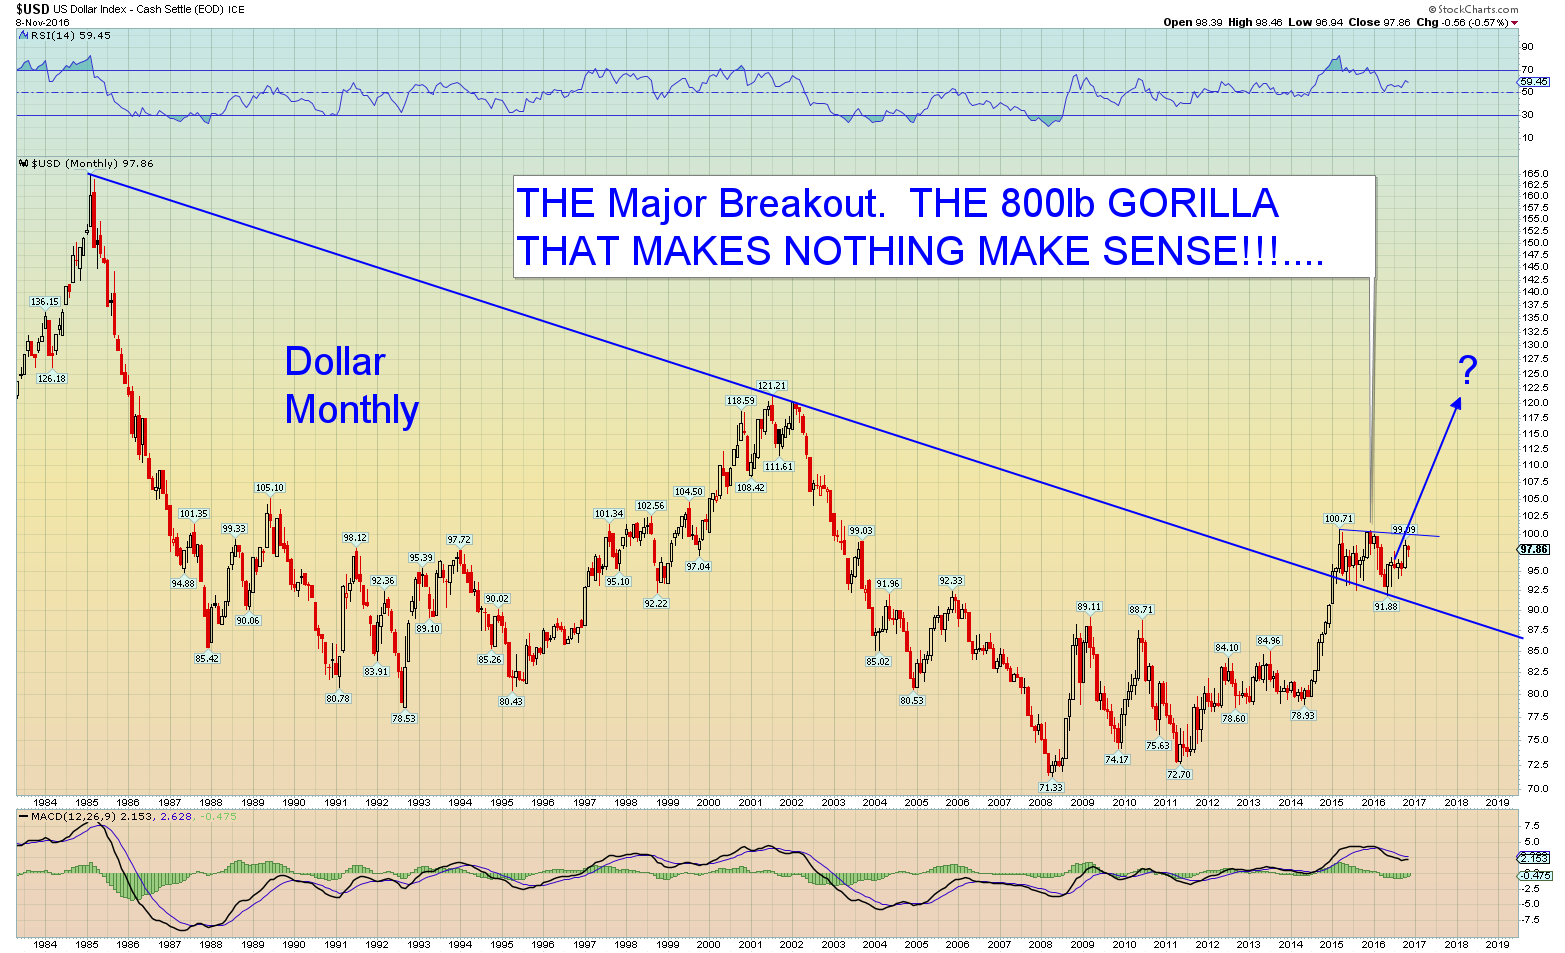
I was early for damn sure and it was costly but that dollar chart can now make sense can’t it!? America is about to be great again and the dollar will roar.
What we’re seeing are one or two day wonders like Brexit. Two days after Brexit the British stock market was making yearly highs… I think we’ll see the same here in the states.
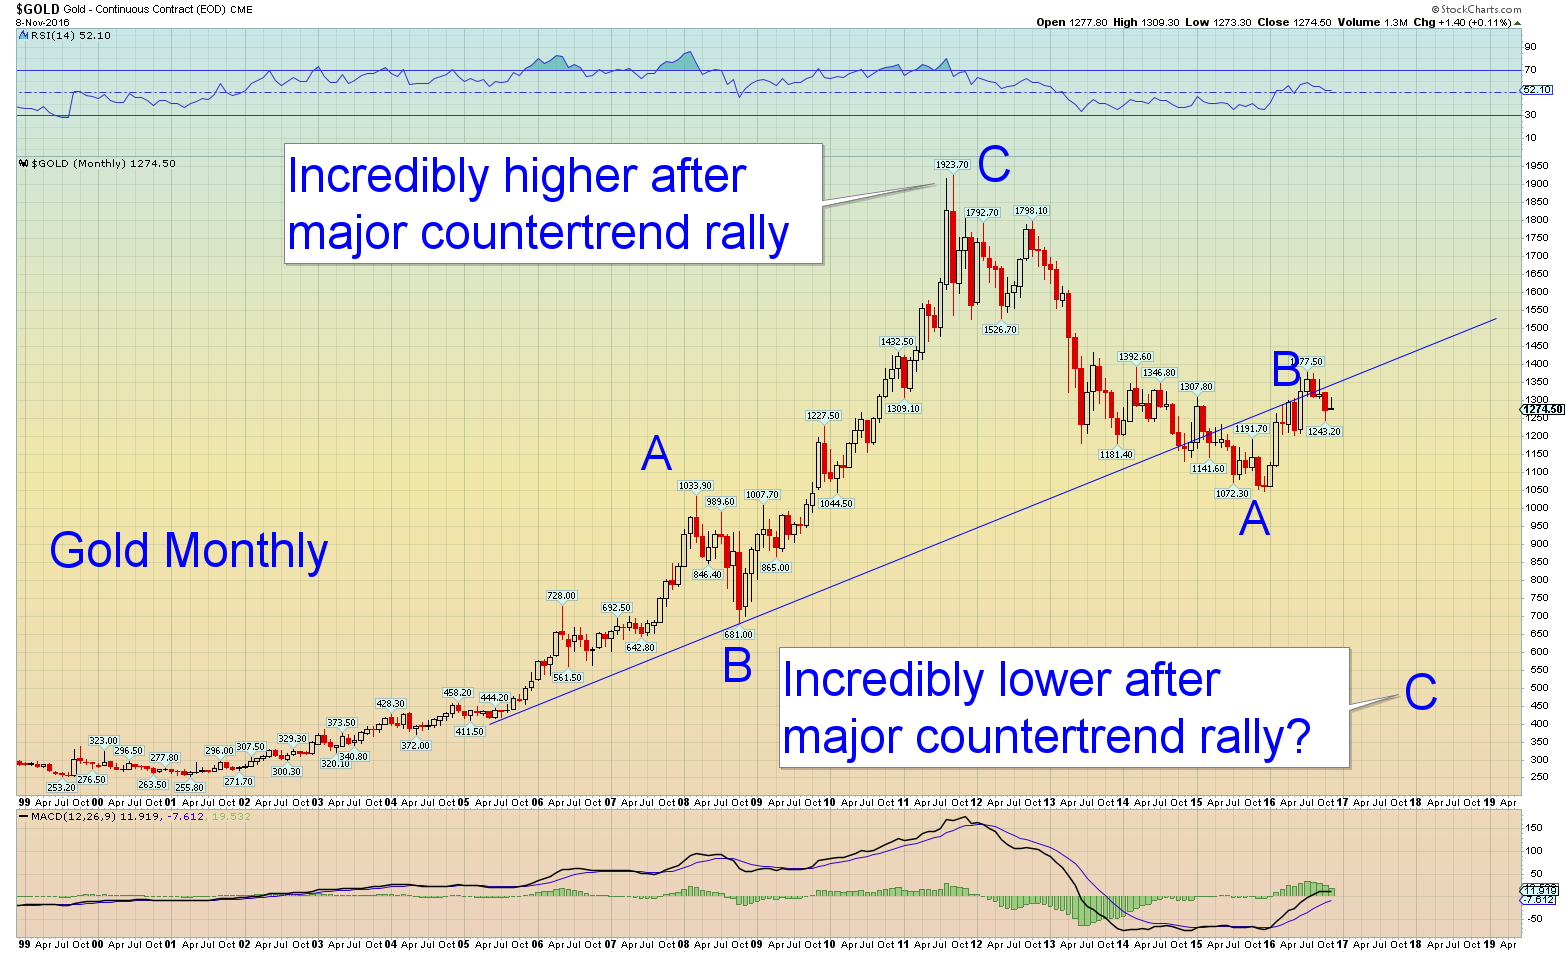
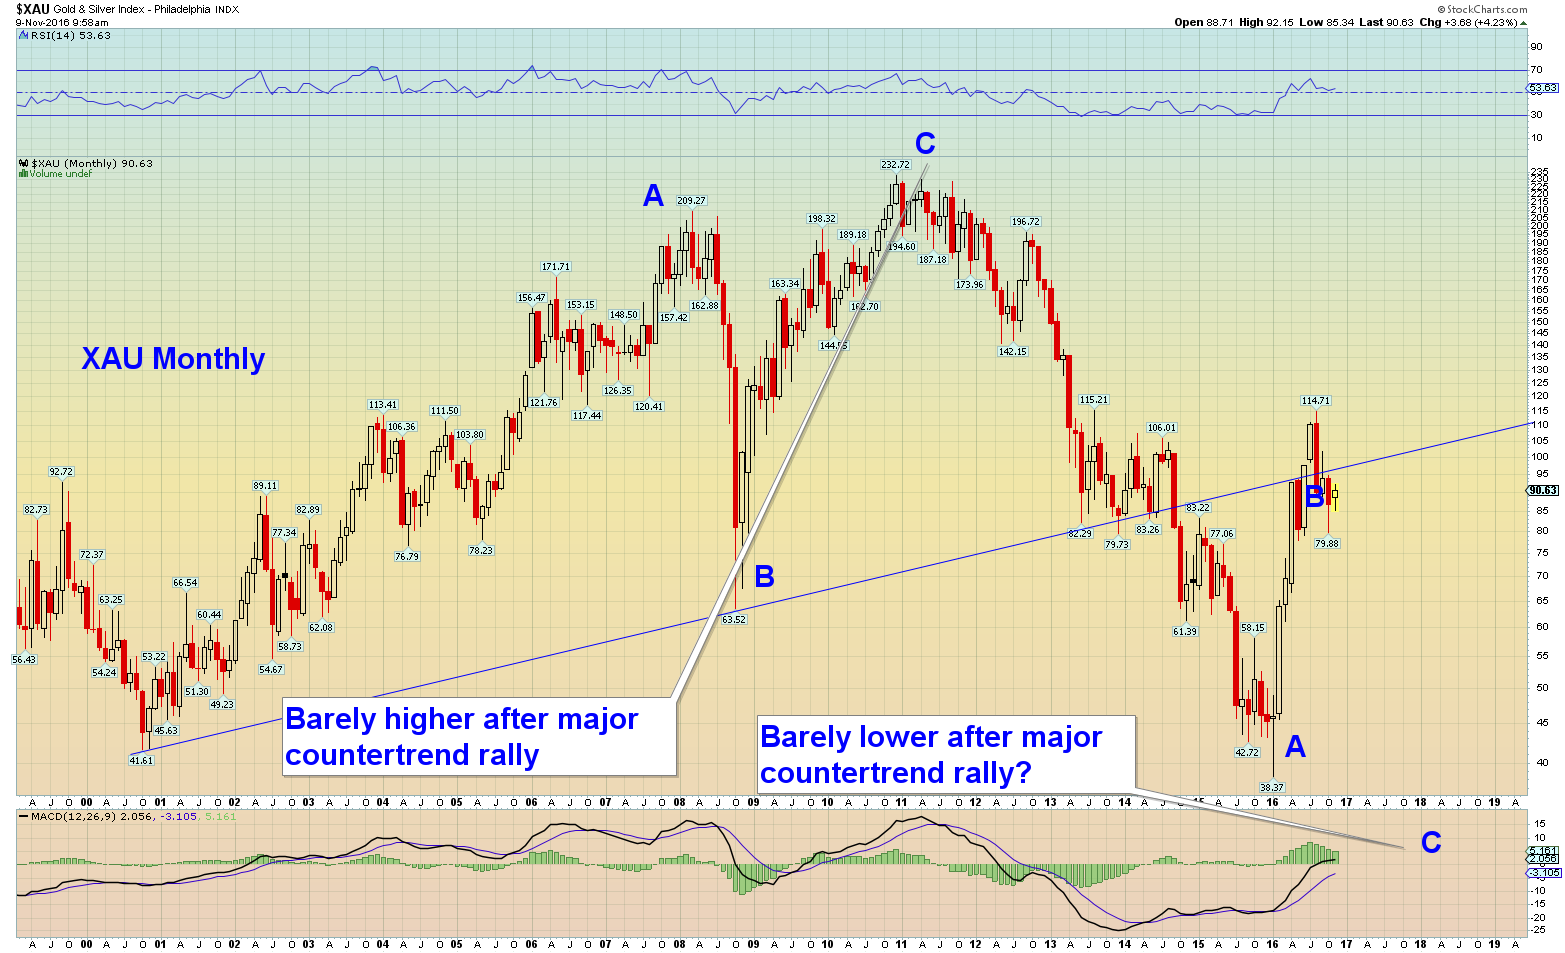
I’m long right now. Thank God. Gonna try to go short gold soon.
Of course, this is an educated guess, and I could be wrong. Good luck to you in your decisions…
Chuck
P.s. The only chart that is new is this first one. The others I haven’t touched in any way in months. Silver on this first log scale chart was nowhere near close to hitting this line below when I first posted this theory. It went up and hit this log scale line later which may turn out to be significant.
Interesting charts, thanks.
Congratulations on the 3rd arrival!
Thanks! Things are already busy and crazy. Can’t imagine life with the 3rd!? ?
I was looking at something exactly the same on the gold chart recently. There is a potentially nasty case of some kind of symmetry playing out!
https://goldtadise.com/?p=383516
“Mischief with Fully’s 20m ema chart bull/bear on gold.
Having a little fun with Fully’s chart on the almost foolproof 20 month exponential moving average gold bull/bear buy/sell indicator, I noticed two possible sets of twins for the bear case. I am not sure which is worse”
I had in mind charts 2 and 3 in my link. Although I was looking at the moves relative to the 20 month exponential moving average, so it was not quite as bearish as your gold chart!
With your symmetry on the gold chart it should return to the blue line and that could be one great buy point at $500!
Nice charts by the way. Who knows. We’ll see!
Cheers, PC!