SPX Stock Cycle Update
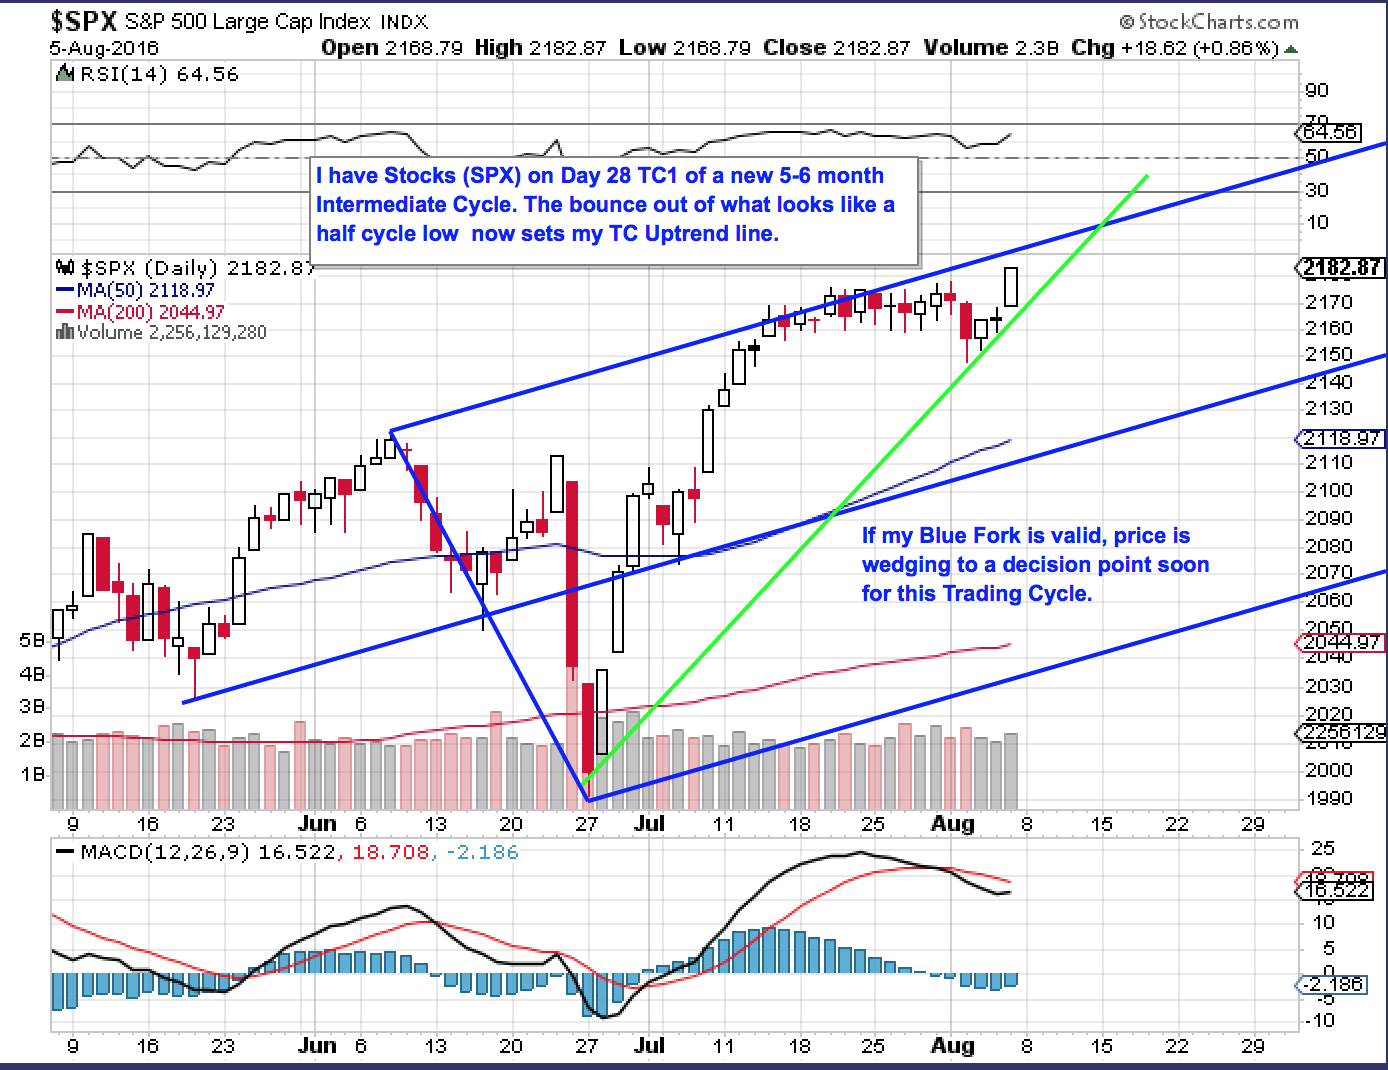
Looks like NFP caused Stocks to bounce out of a half cycle low. We are now on Day 28 of Trading Cycle #1 of the new 5-6 month Intermediate Cycle that started in late June and we usually see the SPX top on or before day 35/36 as the timing band for a low runs 36-45 days.
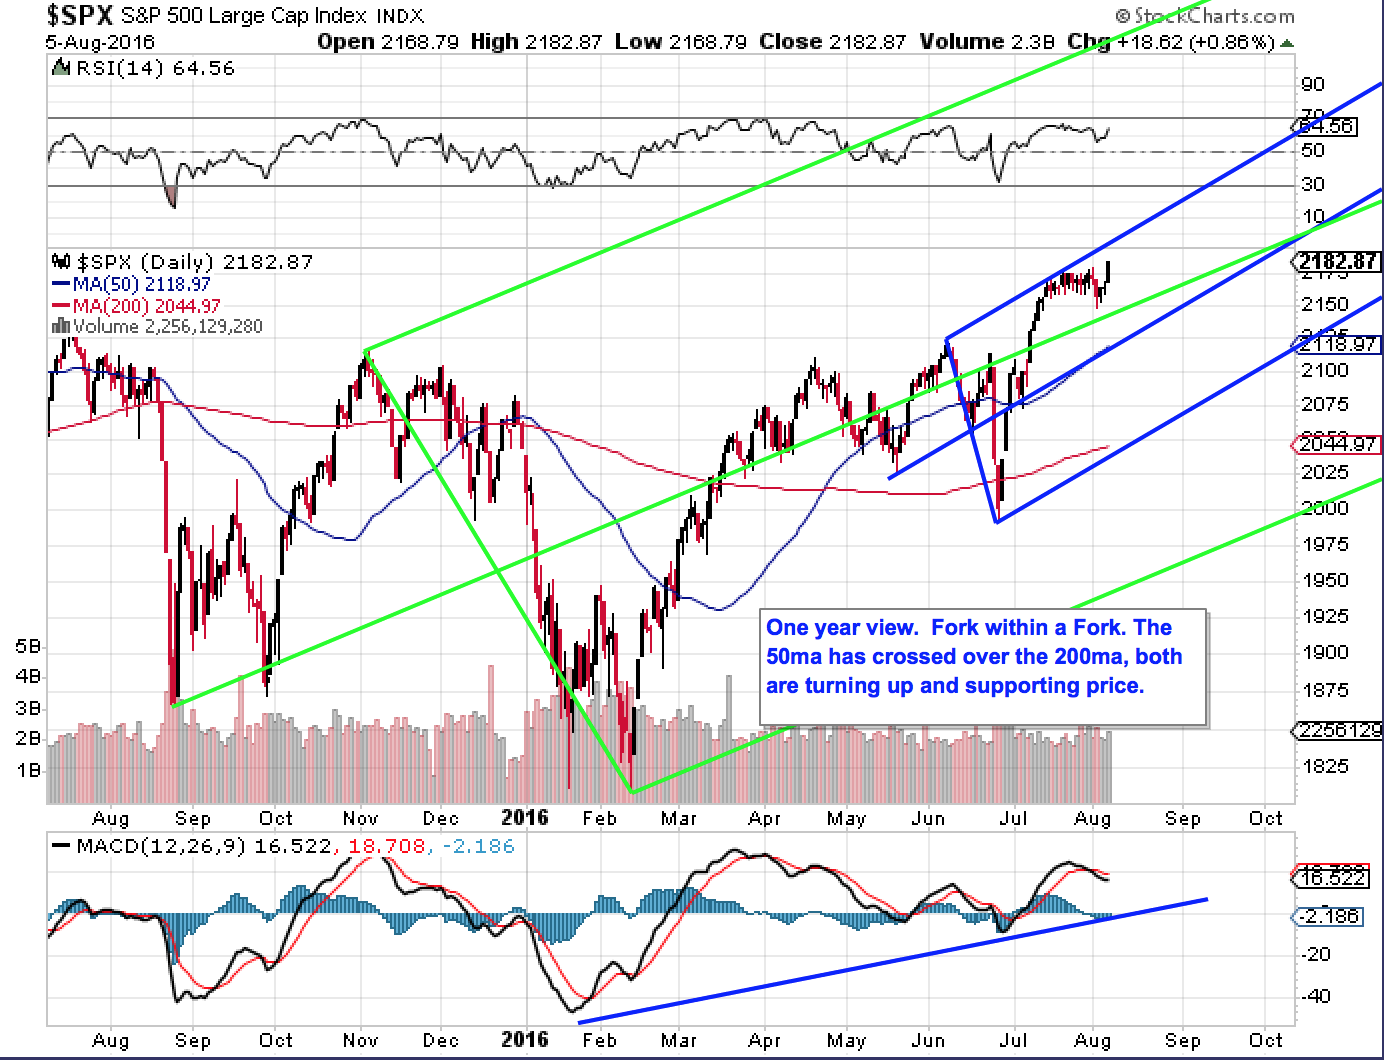
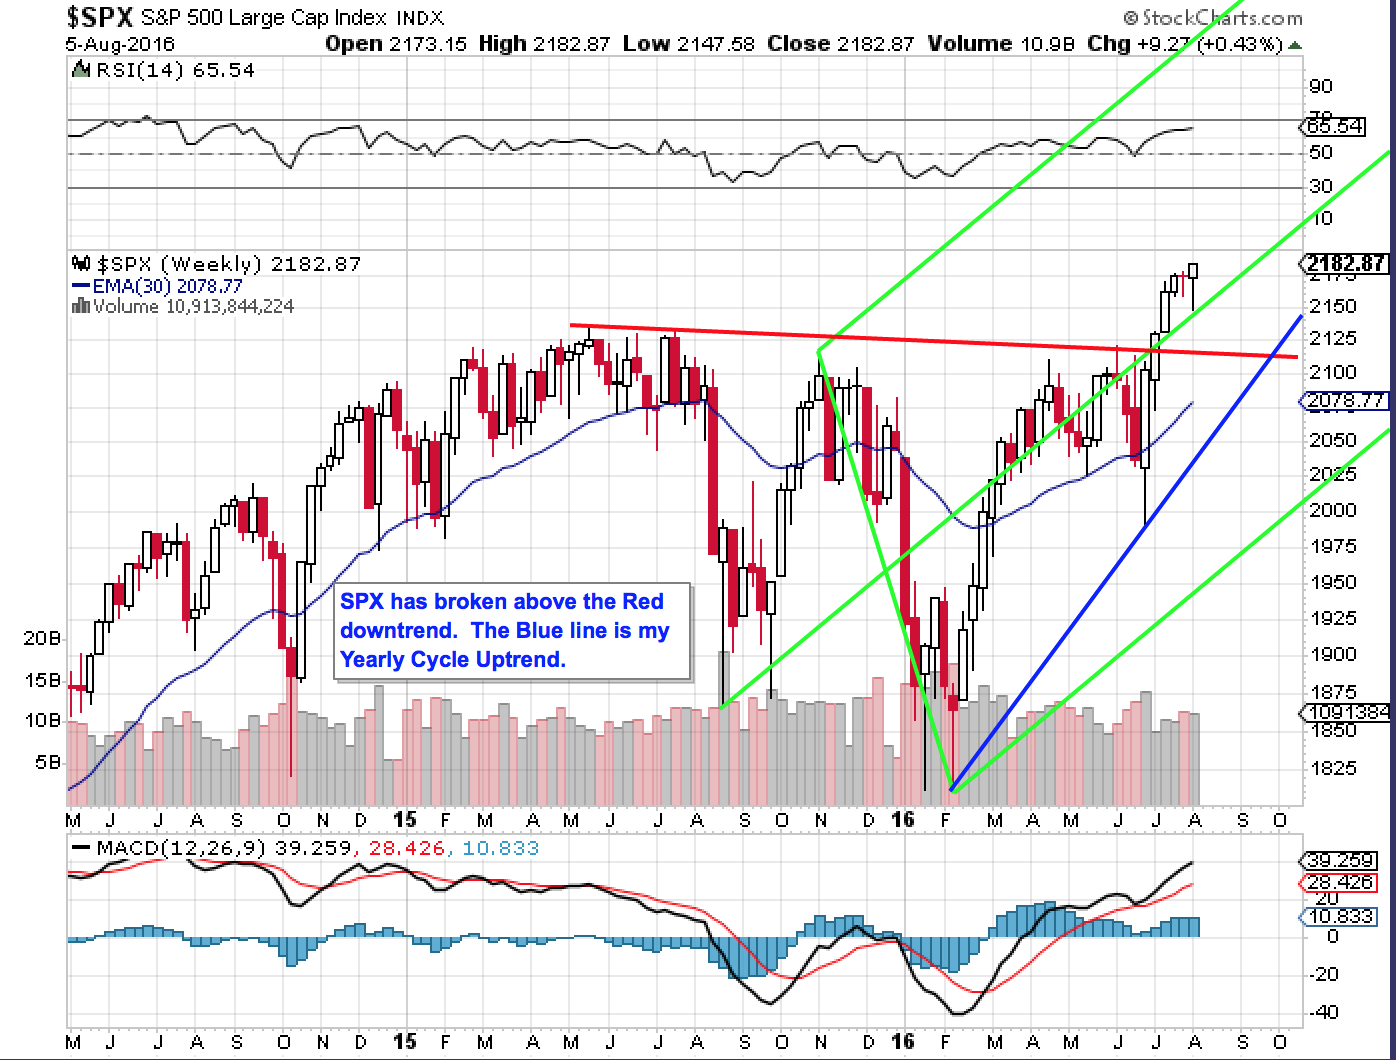
My second chart shows a one year view on the Daily and my 3rd chart shows a 2+ year Weekly. The 3rd chart shows clearly that the SPX and other indicies have broken the Red downtrend line out of the May 2015 top. Also on the 3rd chart, note how the 30ema is on a bit of a roller coaster but has now turned up again and is supporting price at major lows.