WTIC Crude Cycle
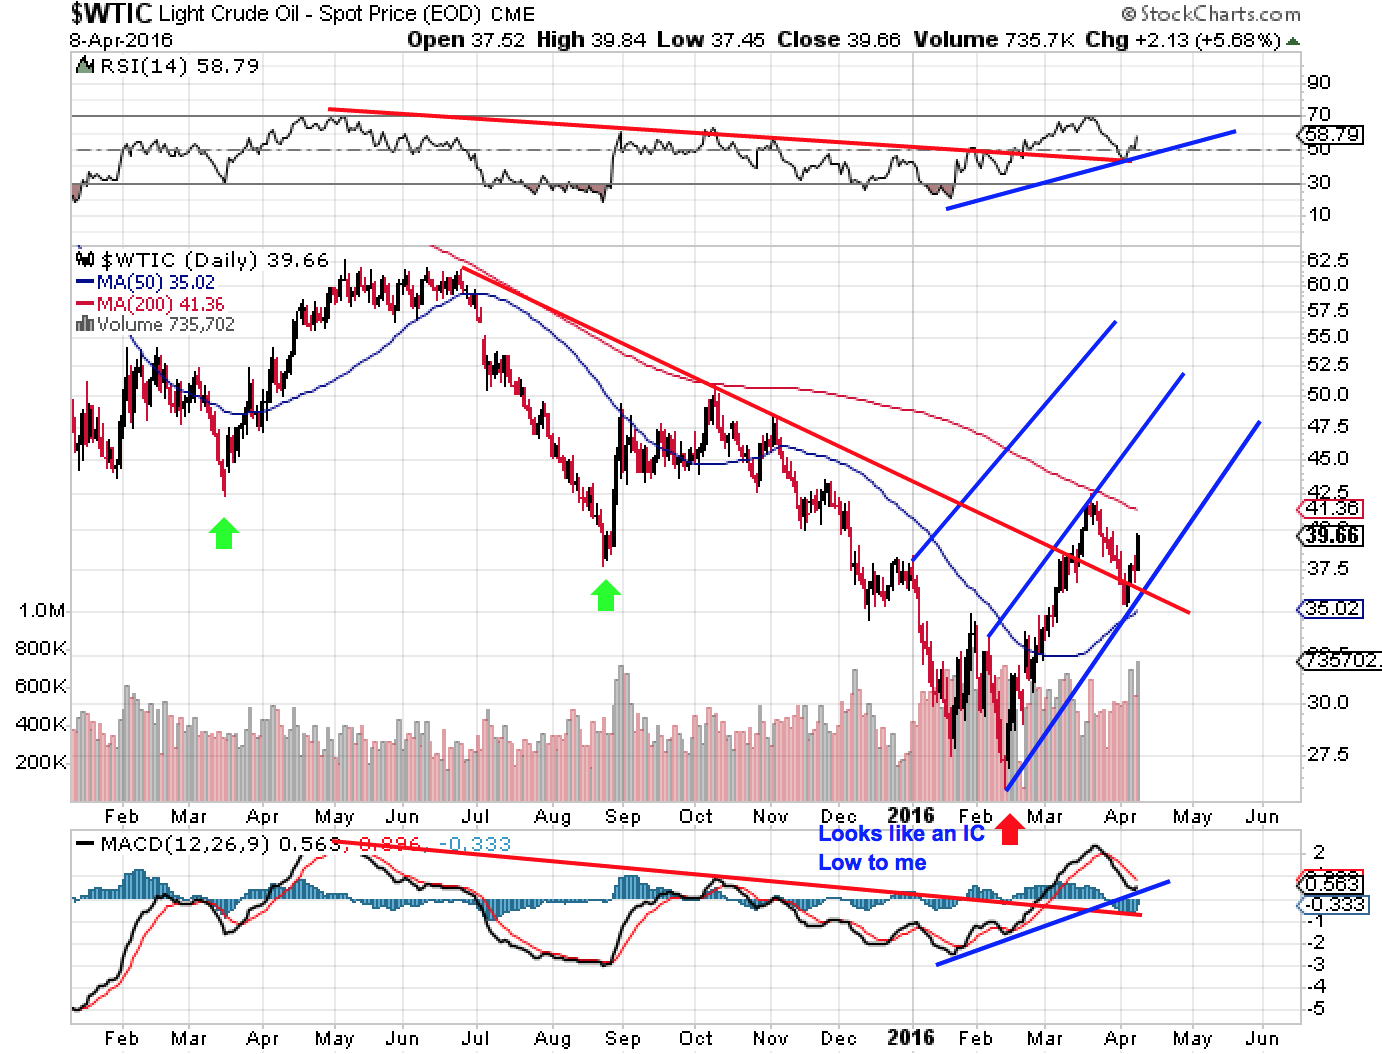
WTIC Crude is bouncing out of what I believe is a Trading Cycle #1 Low (TC1 Low) which sure looks like a new Intermediate Cycle. The first chart is a Daily that shows the nearer term price action where it has backtested the breakout from the current one year downtrend.
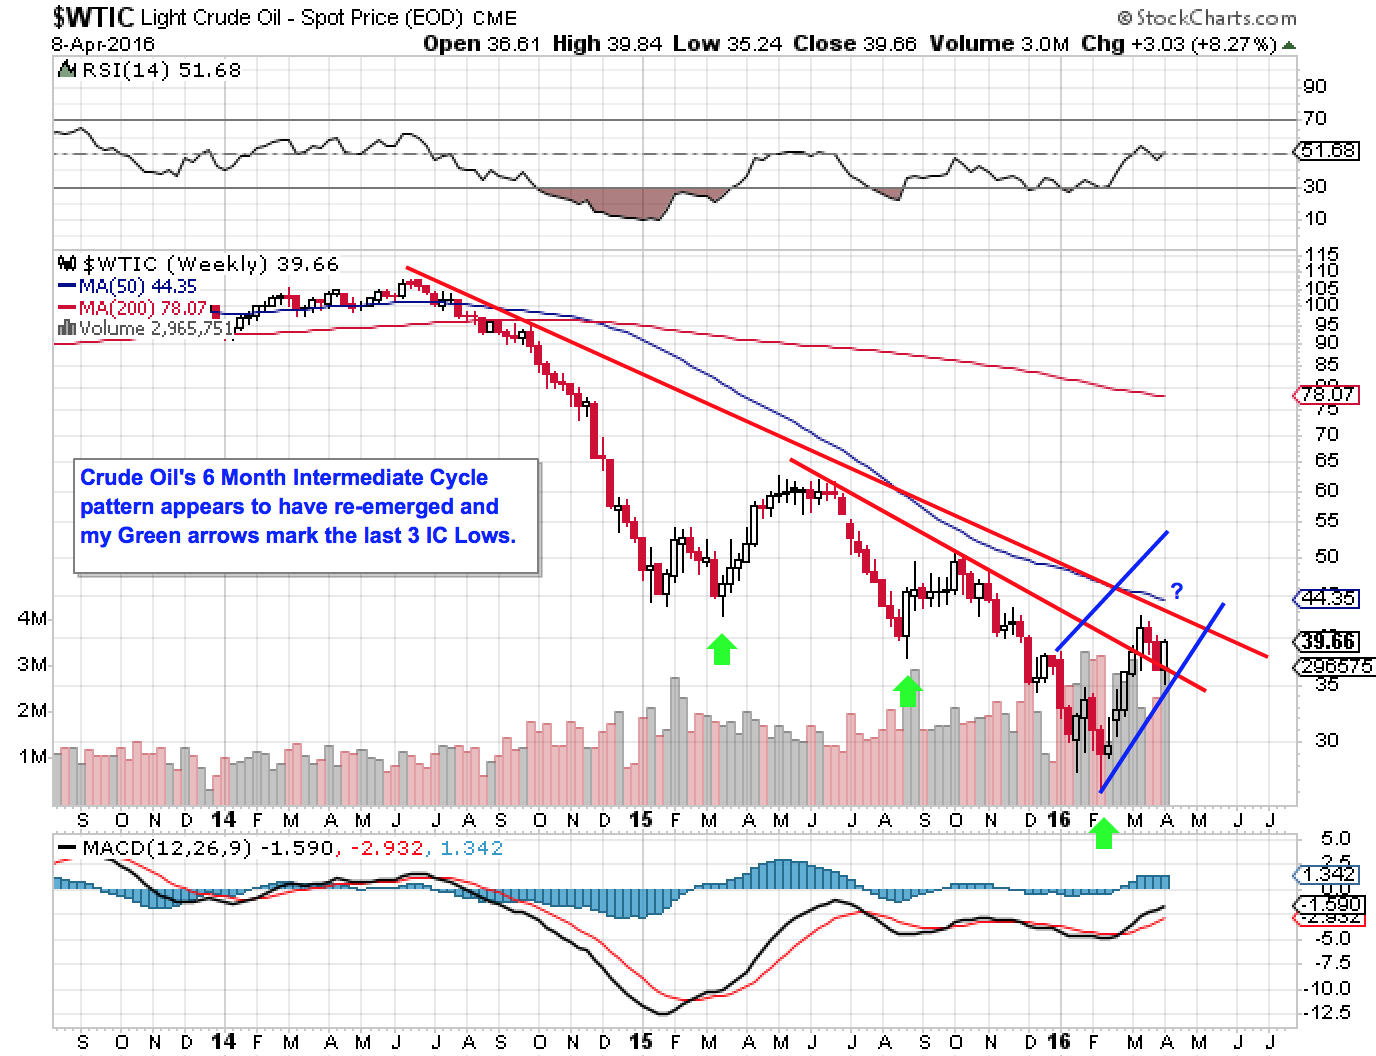
My second chart is a Weekly showing it still has more work to do to confirm that it has found a Bear Market bottom. Note that the upper Red Line on my second chart has not been tested yet and this is the 4 Year Cycle downtrend line for Crude. I would not expect this line to be broken on the first test. Perhaps Oil will find a TC2 top here?