THE ANATOMY OF A SMALL CAP GOLD AND SILVER PRODUCER
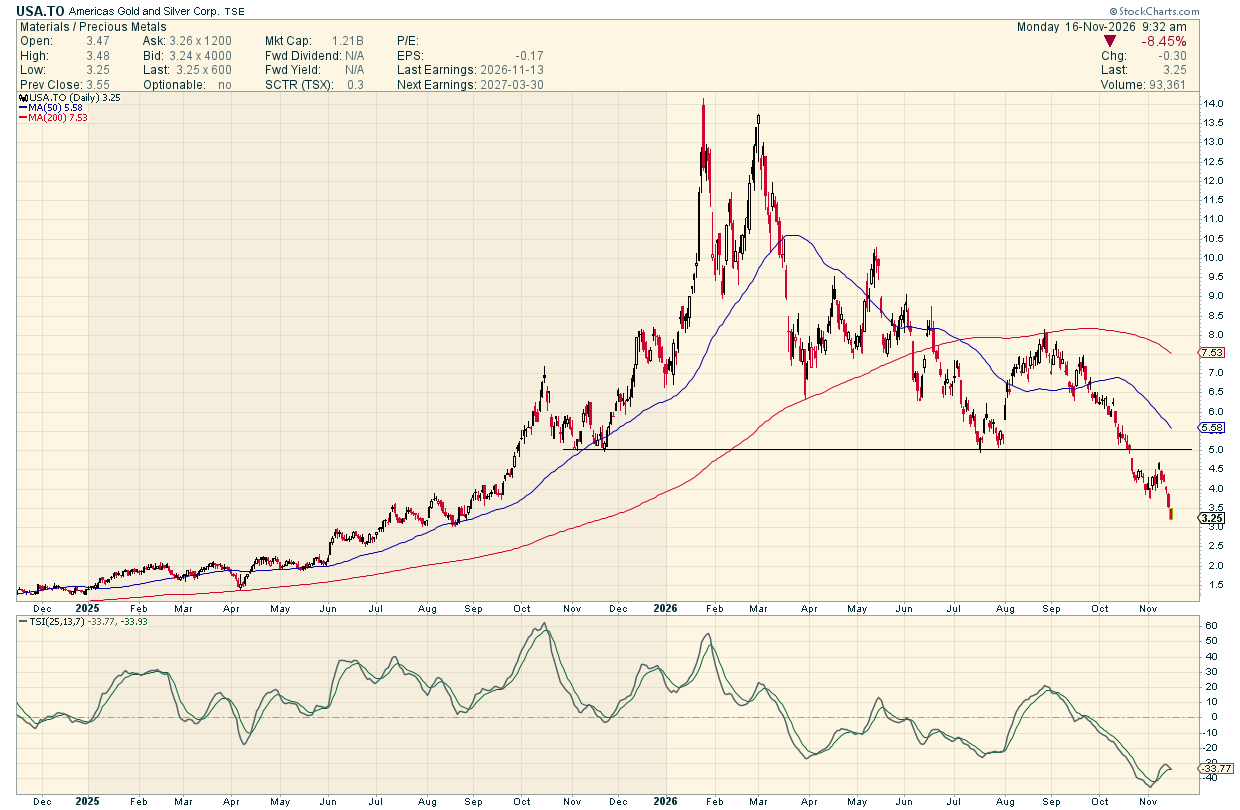
USA.TO I HAVE OWNED SHARES OFF AND ON AS HAVE MANY OF YOU HERE…THIS UNFORTUNATELY IS THE TYPICAL CHART PROFILE FOR THESE THINGS….EVERY SO OFTEN THEY EXPLODE LIKE A FIRECRACKER AND ALWAYS END UP AS ALL FIRECRACKERS DO…FLAMING OUT AND CRASHING….THE TRICK IS TO SELL THE BLAST…BUT MOST ARE TOO ENGAGED WHEN IT IS HAPPENING….WHEN WILL THEY EVER LEARN
Fear and Greed works nicely for shorter term trading in SPX.
But it works only for those trading daily charts.
You need higher time frames to get the larger perspective, and most fail to do that.
So you need YOUR OWN F&G metrics that work at higher degree. Ie, ZOOM OUT.
TO EACH HIS OWN…I HAVE ZERO INTEREST IN ANYTHING BUT SHORT TERM TRADING IN THIS SECTOR. IT’S A SPORT FOR ME
Richard Russell said trade ONLY with the PRIMARY TREND at your back. He’s not alone in that.
So I like to know what that is.
He had a tool for that (his PTI), but I never trusted it. I built my own.
So, on a chart for usa.to, but on the monthly, I noticed that the MONTHLY RSI (9 per) was 99.2 last February. It can only go to 100 (but NEVER does).
Usually, RSI tops (in whatever time frame) in the upper 60s.
So this was a tad OVER THE TOP.
Now the pendulum swings back. How far? My read here is 41, right now.
So, down to (the usual) 30-35, or does it get extreme the other way? Teens? Who knows?
PS — peak RSIs don’t always mark price highs. Usually, divergent lower RSIs are needed before the final top.
I just wanted to make clear that RSI 99 is usually just a warning, not a sell signal, normally.