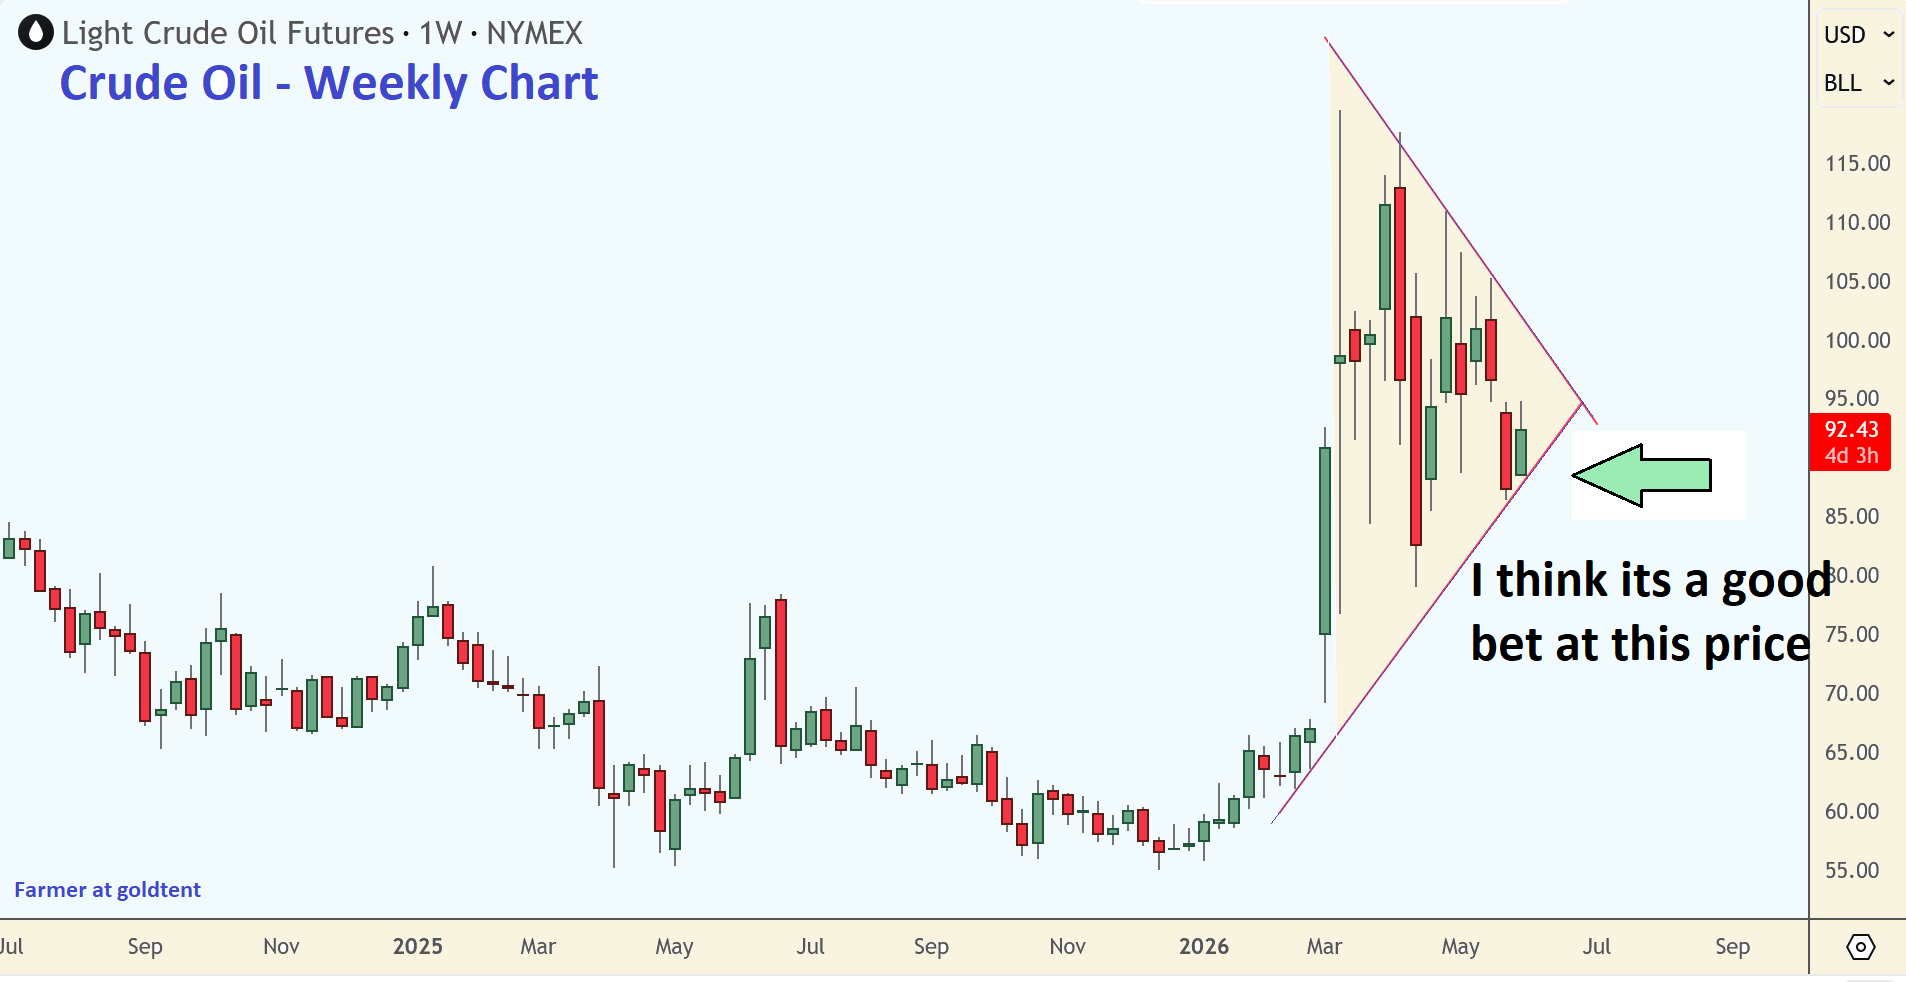
Crude Oil is a Good Bet at Current Prices
As an investment, West Texas Crude is a good bet right now. I can see the future with prices running substantially higher. The charts support me as this symmetrical triangle pattern works its way across the screen. Turns out it was the time period I was using that made the big difference to my clarity. Have a look. This is a weekly chart and it gives more confidence to the trader than my earlier daily chart was showing. So this puts us in the camp of be able to buy WTI stocks with a more promising future than Gold and silver stocks lately. Just my opinion of course. You be your own best judge.
I think the correction gets more complex first, but I’m in agreement on the plan.
And the implications.
They go hand in hand.
Thanks pedro_deleon.
Yup. Oil is far from finished moving up. Lotsa $$$ to be made
I am just researching companies now. Gold was making me tired with all the waiting.
SU, CNQ, EOG, DVN
Thanks Pepppermint!
AR APA
XLE, OIH, ERX, GUSH
Anyone have a favourite? I can make make time to chart or two if you like.
Here is a prompt I’m using on Gemini. Type in AR and the current stock price and see what it says…
Act as a Senior Equity Analyst and Portfolio Manager. Conduct a comprehensive 6-12 month investment evaluation for XXX stock based on today’s price near $/share. Your goal is to determine if the current risk/reward profile is likely to produce market-beating returns within a $1M portfolio. Provide the analysis in the following sections:
1. Secular Alignment & Growth:
Identify the primary secular trend this company belongs to.
Provide a summary of 5-year projected revenue and EPS growth rates.
Compare current valuation (P/E, EV/EBITDA, and PEG ratio) against its 1-year forward estimates and its 5-year historical average.
2. Risk Assessment (The Bear Case):
Detail 3 company-specific risks to future operating performance.
Analyze the current geo-political environment’s specific impact on this company’s supply chain and target market.
3. Smart Money & Sentiment:
Insider Activity: Summarize net buying/selling activity over the last 6 months.
Short Interest: Provide current short interest as a % of float and evaluate the potential for a short squeeze or a ‘red flag’ sentiment.
Options Market: Calculate the implied move over the next 6 months based on current straddle pricing/volatility.
4. Technicals & Timing:
Analyze the current trend using RSI, MACD, and the 50-day/200-day Moving Averages. Analyze the last 6 weeks of volume data to determine if investors are accumulating or distributing the shares.
Identify a ‘Strong Buy’ entry zone and a ‘Stop Loss’ level.
Assess the likelihood of current momentum continuing vs. reversing over the next 6 months.
5. Portfolio Strategy:
Provide a definitive ‘Buy, Hold, or Avoid’ recommendation.
Suggest a position size for a $1,000,000 portfolio (as a % and dollar amount), considering the risk profile.
Establish a 12-month price target based on projected forward multiples.