Crude Oil is at a bounce point
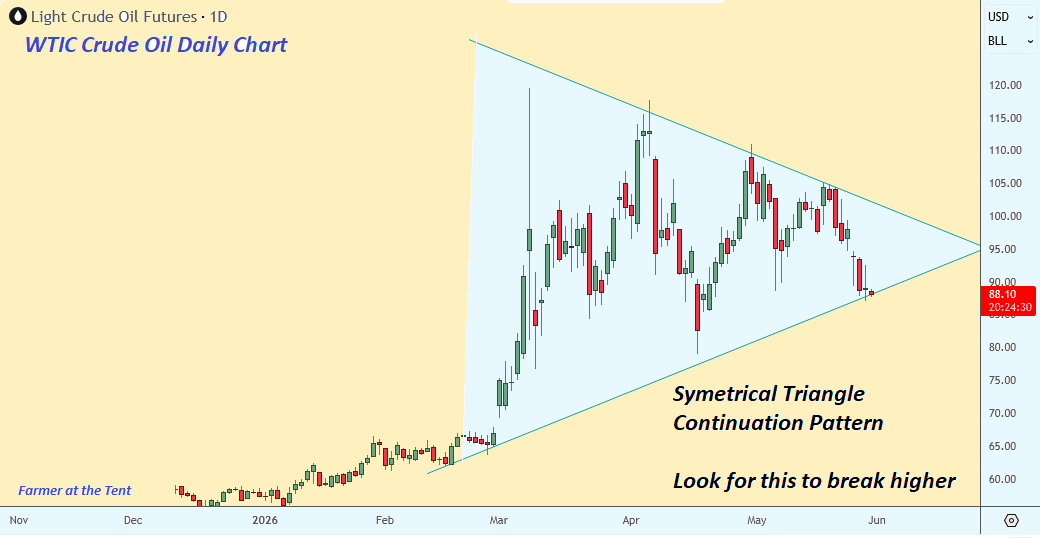
Hey Fully, I finally found time to answer you about the Crude Oil chart. All is not as well as you might imagine. Please look at how a drawing is done when the basis is a Symetrical Triangle. Hopefully this will clear up doubts about where price is heading as this is a classic continuation pattern at this stage of the trade. I had noted in an earlier post that price projects to 150 dollars. Its actually a little higher nearer 165 but that will not matter until the day arrives. I hope you will not get caught on the wrong side of this trade though.
Edit: I cannot rule out that price won’t break down from this weeks low. If a real deal over Hormuz makes the newswire I will bite my tongue and agree your initial assessment was correct. Until then we will wait and see because it looks like we will get walloped by inflation everywhere once those higher prices start creeping into into our day to day shopping adventures.
I bought a dairy cow this week in expectation of milk prices going up. She is a beauty. Cost me about 900 dollars. We also added chickens and another Donkey. That is hardly my real worry though. I am almost in the same time zone as Tehran and ships plying those waters nearby have not been getting through to Mombassa. Cargo that people have been waiting for in Kenya is trapped behind the Hormuz Straits. Medications and things like that included. Thank God I had large supplies on hand or I would be sweating right now!
THANKS FOR CHECKING IN SIR FARMER…WOW ANOTHER DONKEY ? COOL !
YOU LEAD A LIFE SO FOREIGN TO ALL THE REST OF US ITS INCREDIBLE TO CONTEMPLATE FROM HERE
I DO NOT AGREE WITH THAT SYMETRICAL TRIANGLE THINGY
ALL MY CHARTING EXPERIENCE ..MUCH LEARNED FROM FOLLOWING RAMBUS AND READING EDWARDS AND MAGEE SAYS DRAW THE SUPPORT RESISTANCE LINES BY CONNECTING THE MOST POINTS ON A CANDLSTICH CHART …POINTS MEANING EITHER HIGHS / LOWS ( WICKS OR OPEN AND CLOSES ( BODY)
THERE IS NOTHING I HAVE EVER SEEN THAT SAYS A TRIANGLE NEEDS TO BE PRECISELY SYMMETRICAL …SO HERE IS MY CHART WITH A LOT OF TOUCHES ON BOTH LINES OF THE TRIANGLE
COMPLETE WITH BREAKOUT GAP AND NOTE THE TOP LINE SHOWS 3 LOWER HIGHS AND JUST NOW A LOWER LOW HAS BEEN PRINTED
Yes, life is sure different here. We also got a couple of bulls for pulling a wheeled cart and plowing when the season comes. We are fertilizing the traditional way here. With animal manure and then seasonal nitrate rich crops like peas to enrich the soil for maize. So no worries about things on that end.
Well I won’t make any absolute claims. Even Edwards and Magee left room for probabilities as there were only rare structures that had definitive conclusions for them. So you should not use them as your evidence you are correct either. Times have changed. In the days of Edwards and Macgee very little of trading was computer automated. These days its almost 87% so precision is likelier where doubts exist about symmetry. The third point of interest is that this is a daily chart and so will not be concluded until the day is done. What we will be most interested in seeing is the final move into days end and wether the candle body is inside the triangle or if the body of the candle protrudes into the space below with only the wick protruding. Like all good suspense movies we won’t get the triggering information until after the days close when the deeds been done!
So there is no final conclusion yet. We will just have to wait and see.