Platinum chart….
Weekly chart showing 200 week Bollinger bands (200,2). Note how tight they are at present. The indicator at the top is the actual 200 week BB width tracked over time.
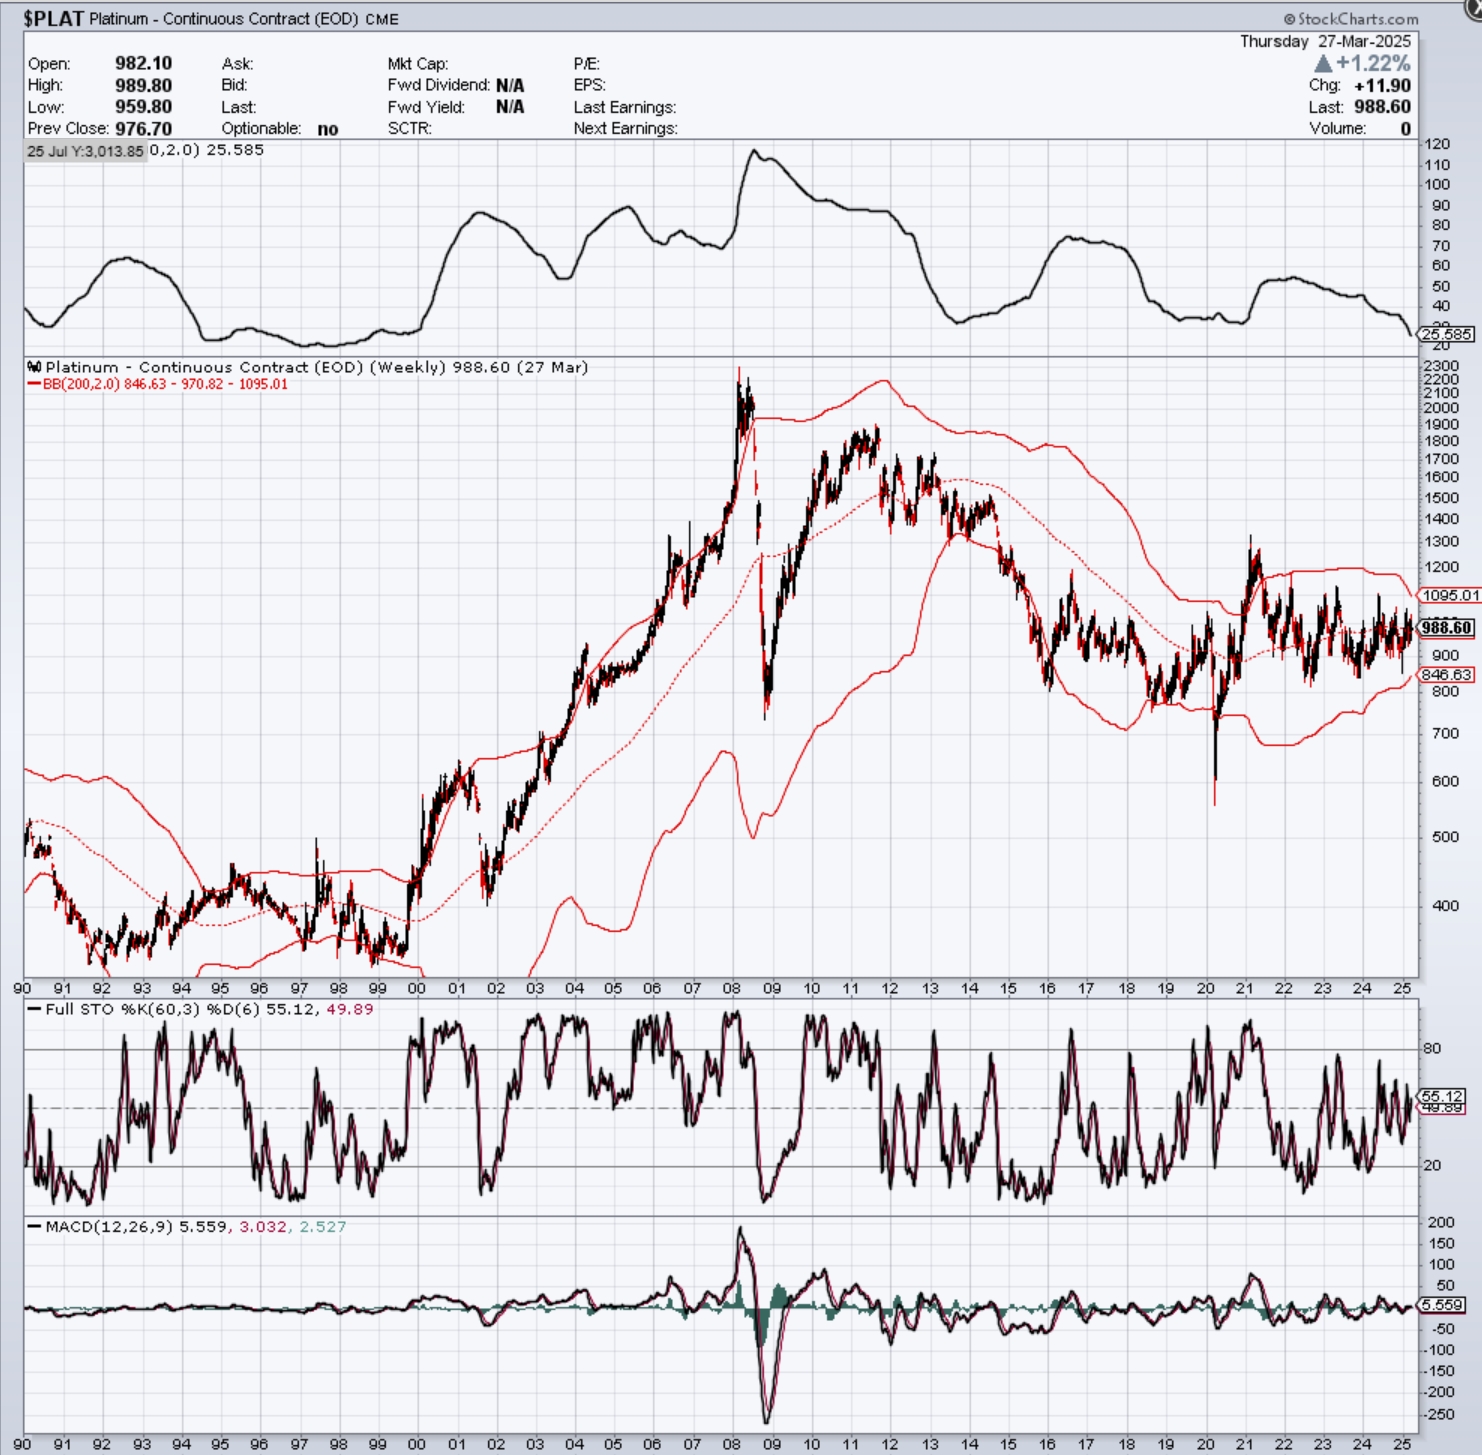
Weekly chart showing 200 week Bollinger bands (200,2). Note how tight they are at present. The indicator at the top is the actual 200 week BB width tracked over time.
So you DID mean 200 for BBW!
Wow.
Never seen that before.
Thx
I have found that the tight boly bands usually give a false move in the other direction before the blast, one last clean out of shares to get the short cover rallies.
It could well be. I wouldn’t be shocked to see plat hit $700 if the stock market crashes further before rocketing off in the opposite direction when TPTB roll out stimulus.
the other if is if Trump removes sanctions on Russia and platinum enters the market again… doubtful but who knows with those 2 anymore.