HUI
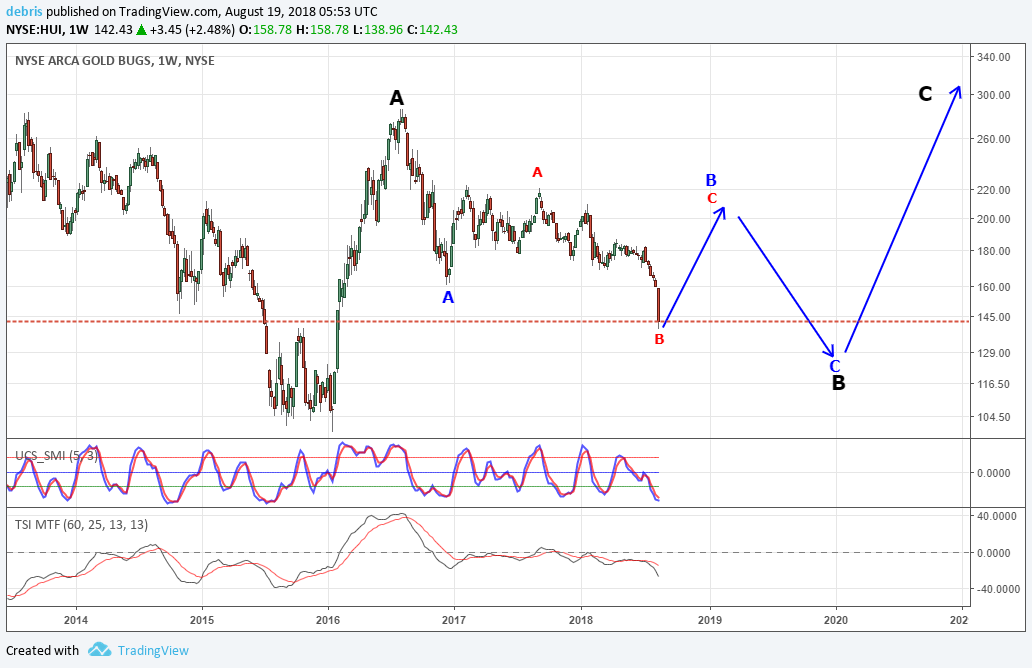
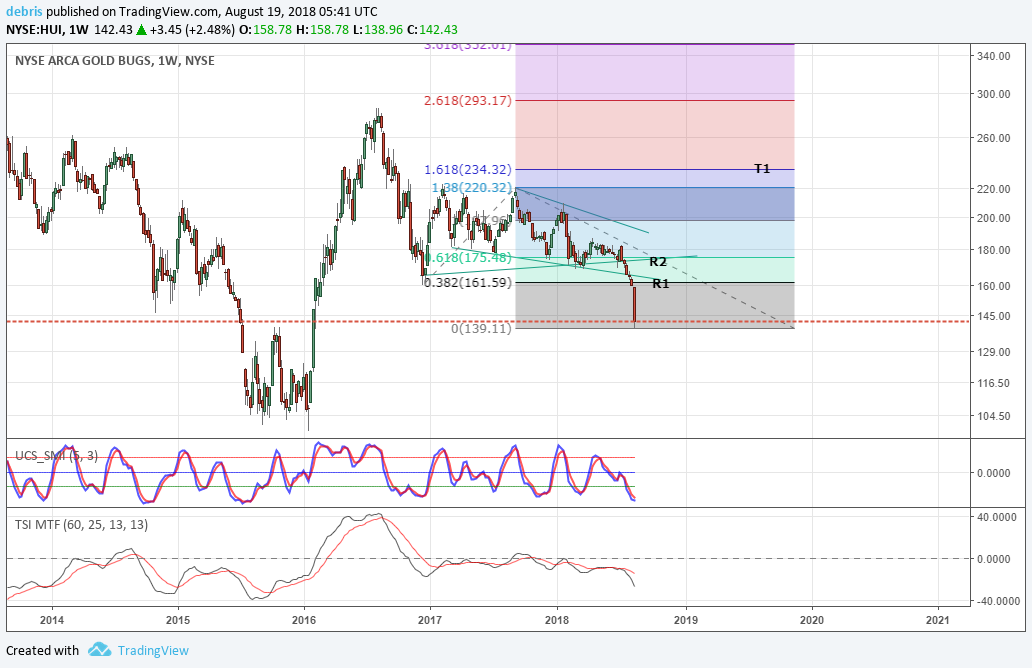
The first chart is a broad Elliott outline showing the possibility of a flat completing at blue B. The likely target is 234 in this case, slightly higher in percentage terms compared to the 29.7 GDX target. On the other chart you can see R1 is the first test. It is the 38.2% Fib retracement of combined patterns and the TL test. R2 is another TL test. The chances of reaching T1 greatly improve if R2 is exceeded. We need to see an impulsive pattern develop off this last low. It is highly likely to fail at R1 on the first attempt but if it pulls back in a corrective manner should break through later in what would be wave 3 of red c.