USD
Just a few different ways of viewing USD related charts:
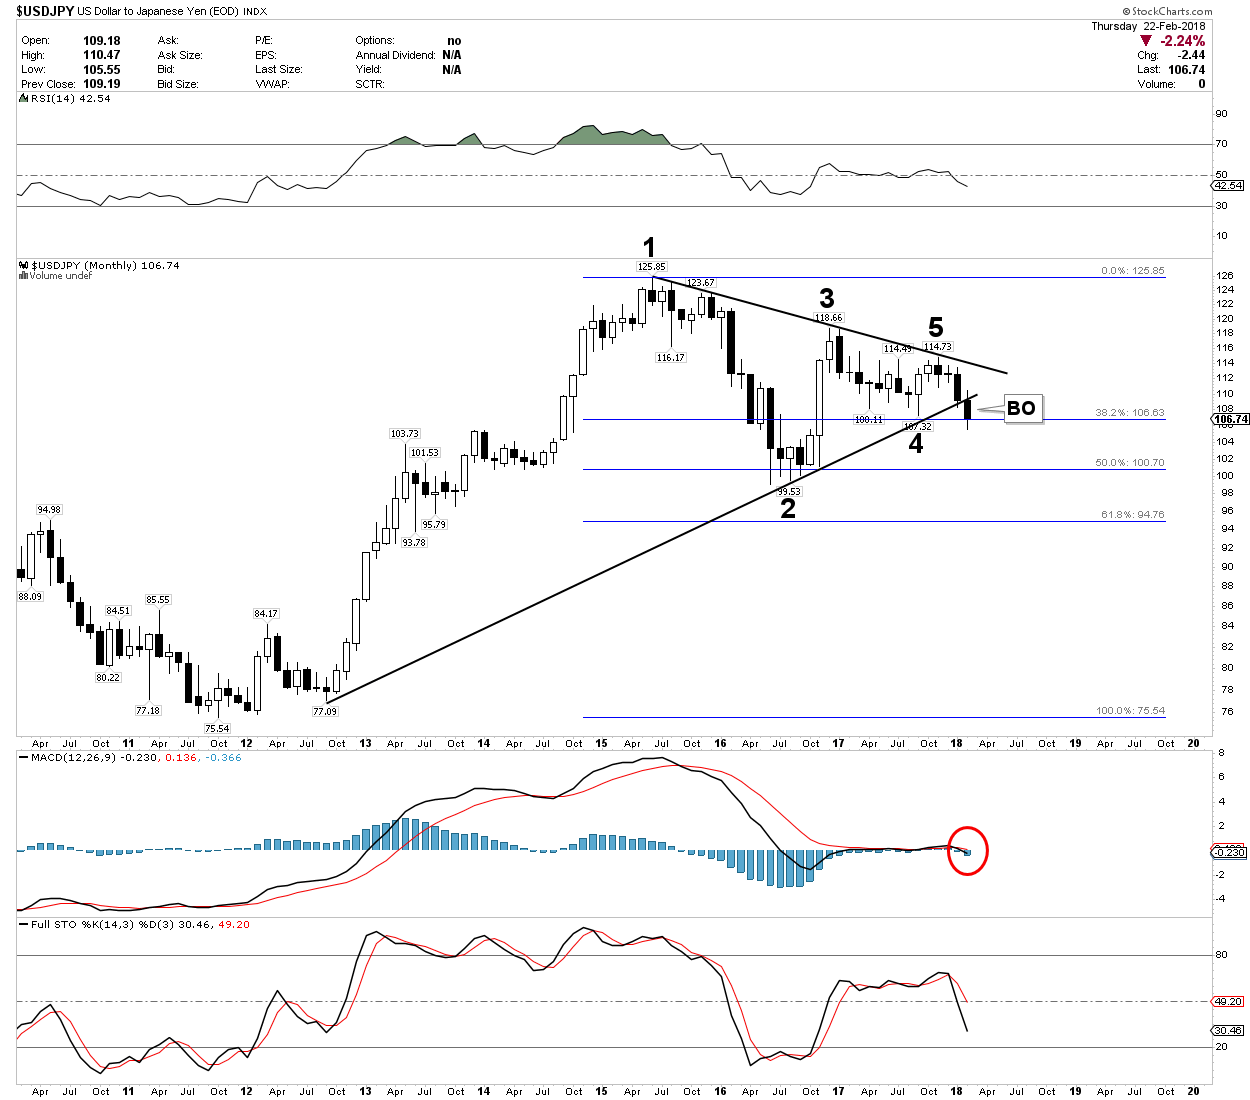
USD v. Yen – Monthly – Symmetrical Triangle: Looks like a bearish 5-pt reversal to me…
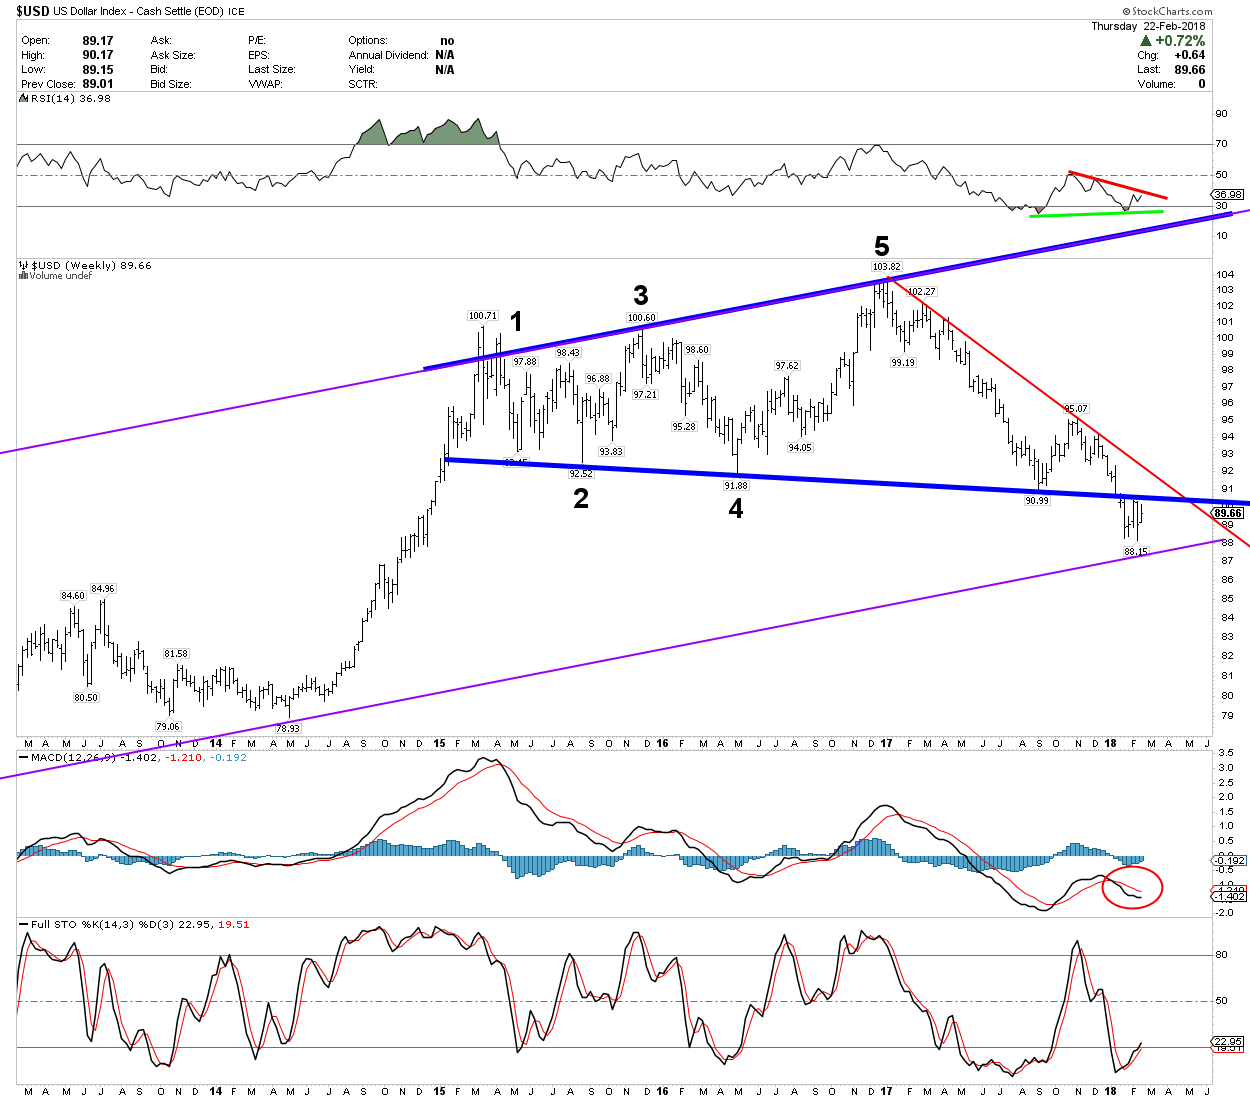
USD Weekly – Expanding Wedge Top. Well, it’s not like price made 4 contact points (instead of 5) and broke out to the upside, in bullish fashion. Quite the opposite.
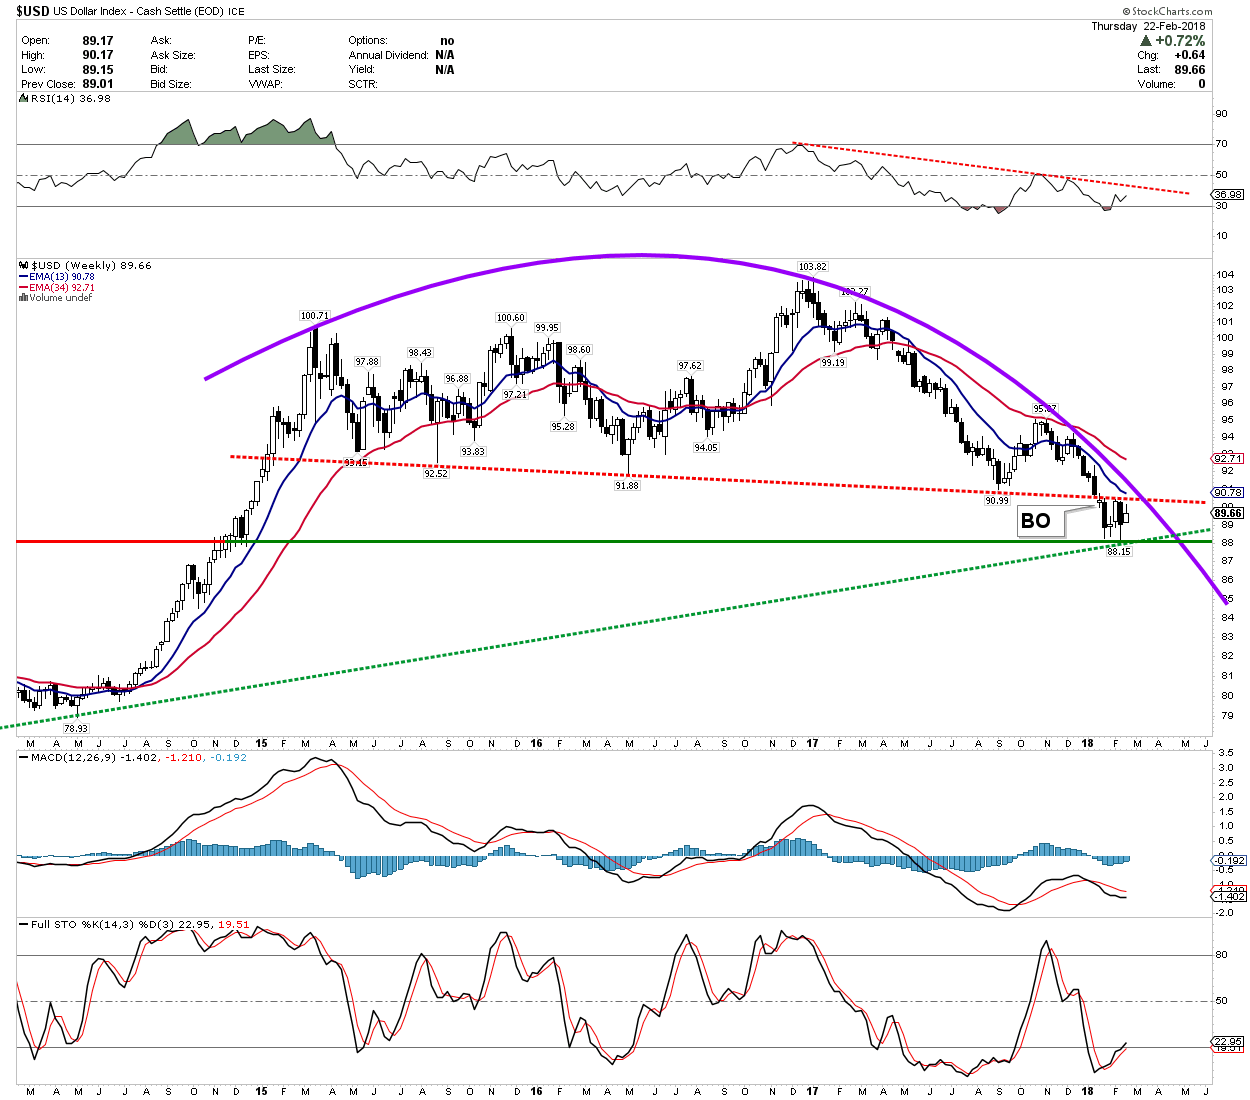
USD – Weekly – Dome Top. And now price is clearly bound between the opposing forces of support and resistance…like squeezing a balloon! 🙂
Great work RTV. Thanks for sharing!
yw chuck!
it’s going to be interesting one way or another…when this balloon pops!
Great look RTV
There are often both bullish and bearish ways of drawing a chart. The correct version is the one which takes into account where we are in the cycle.
Great charts!