WTI
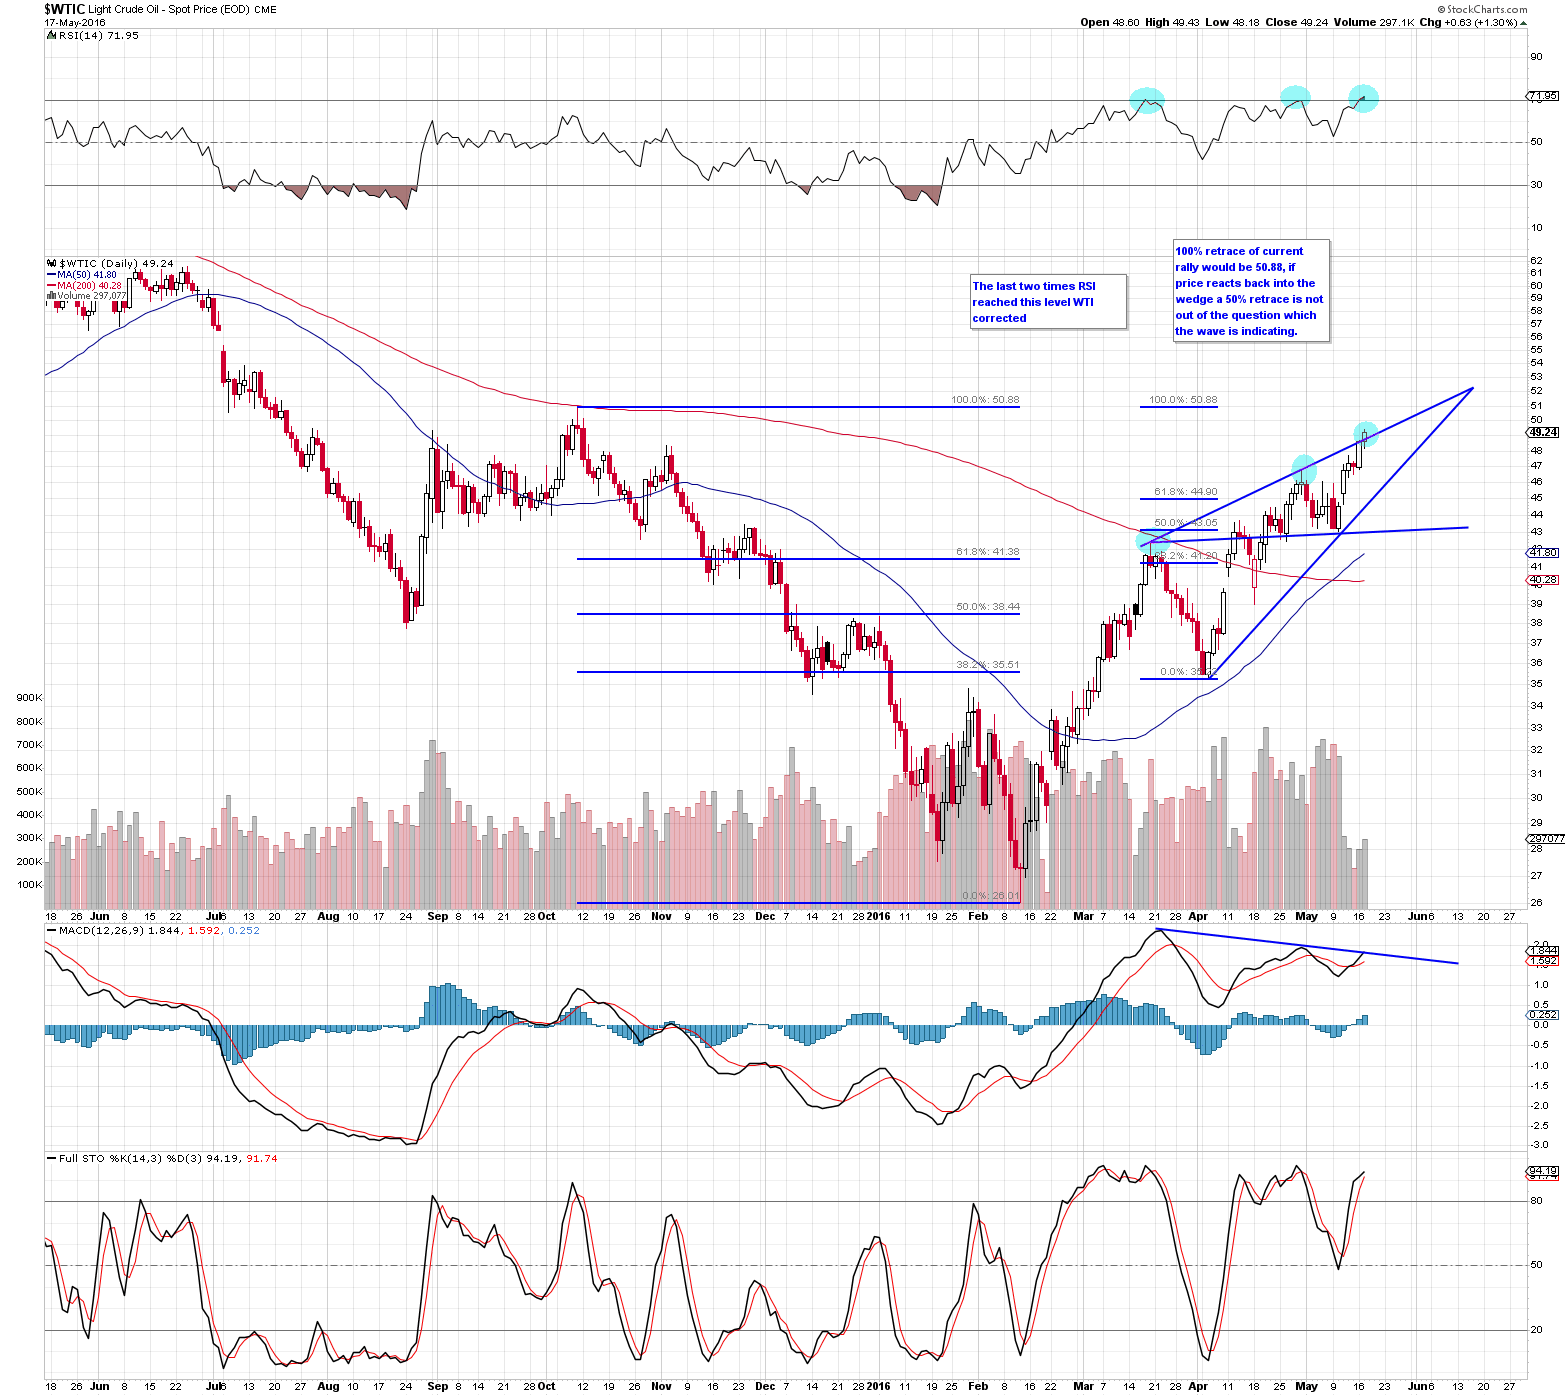
First time using stockcharts, nice to have the fib tool. I have gotten the $51-$52 peak as a price point from different indicators but nice to see the fib tool also confirm, there is a possible Wolfe wave forming that we can use as an entry point for a short, applying the fib tool to the recent rally also gives us the $43 price point with a 50% retrace, coincidence? Still learning but doesn’t the volume on this rally look pathetically weak?
Not sure about volume bars on a commodity
Likely futures volume on the near month…which drops as a roll over approaches