Gold Miners GDX Cycle
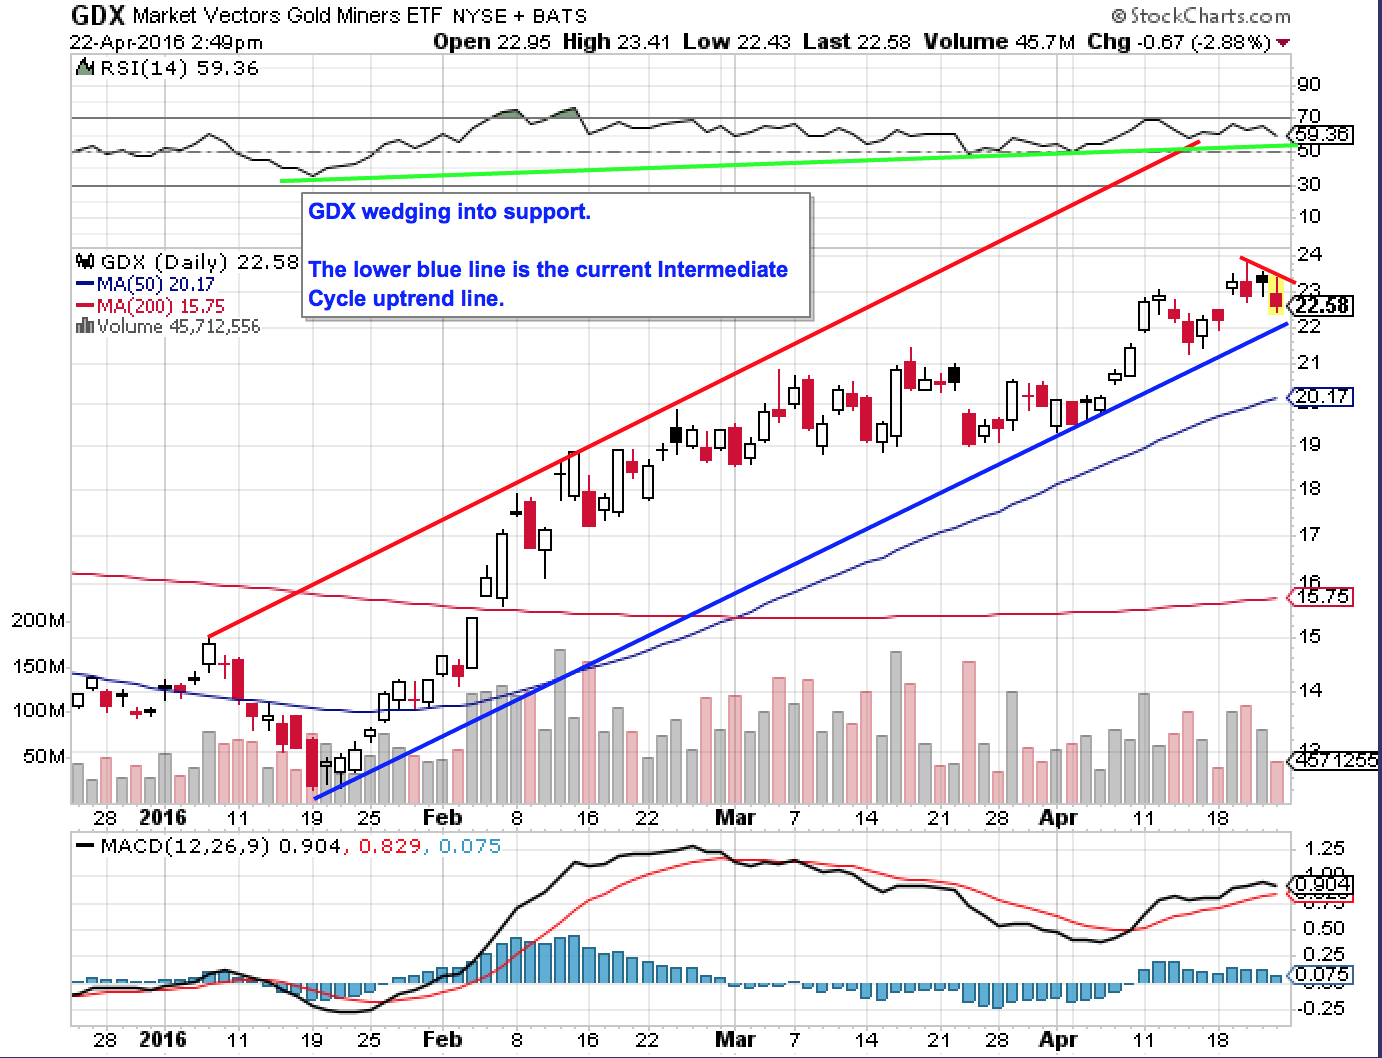
Here are a couple of Gold Miner Intermediate Cycle (IC) Charts. The first is a Daily of the current 5-6 Month GDX Intermediate Cycle. The lower blue line of the channel is also my IC Uptrend line. Price breaking below that line would likely move GDX into its next IC Low.
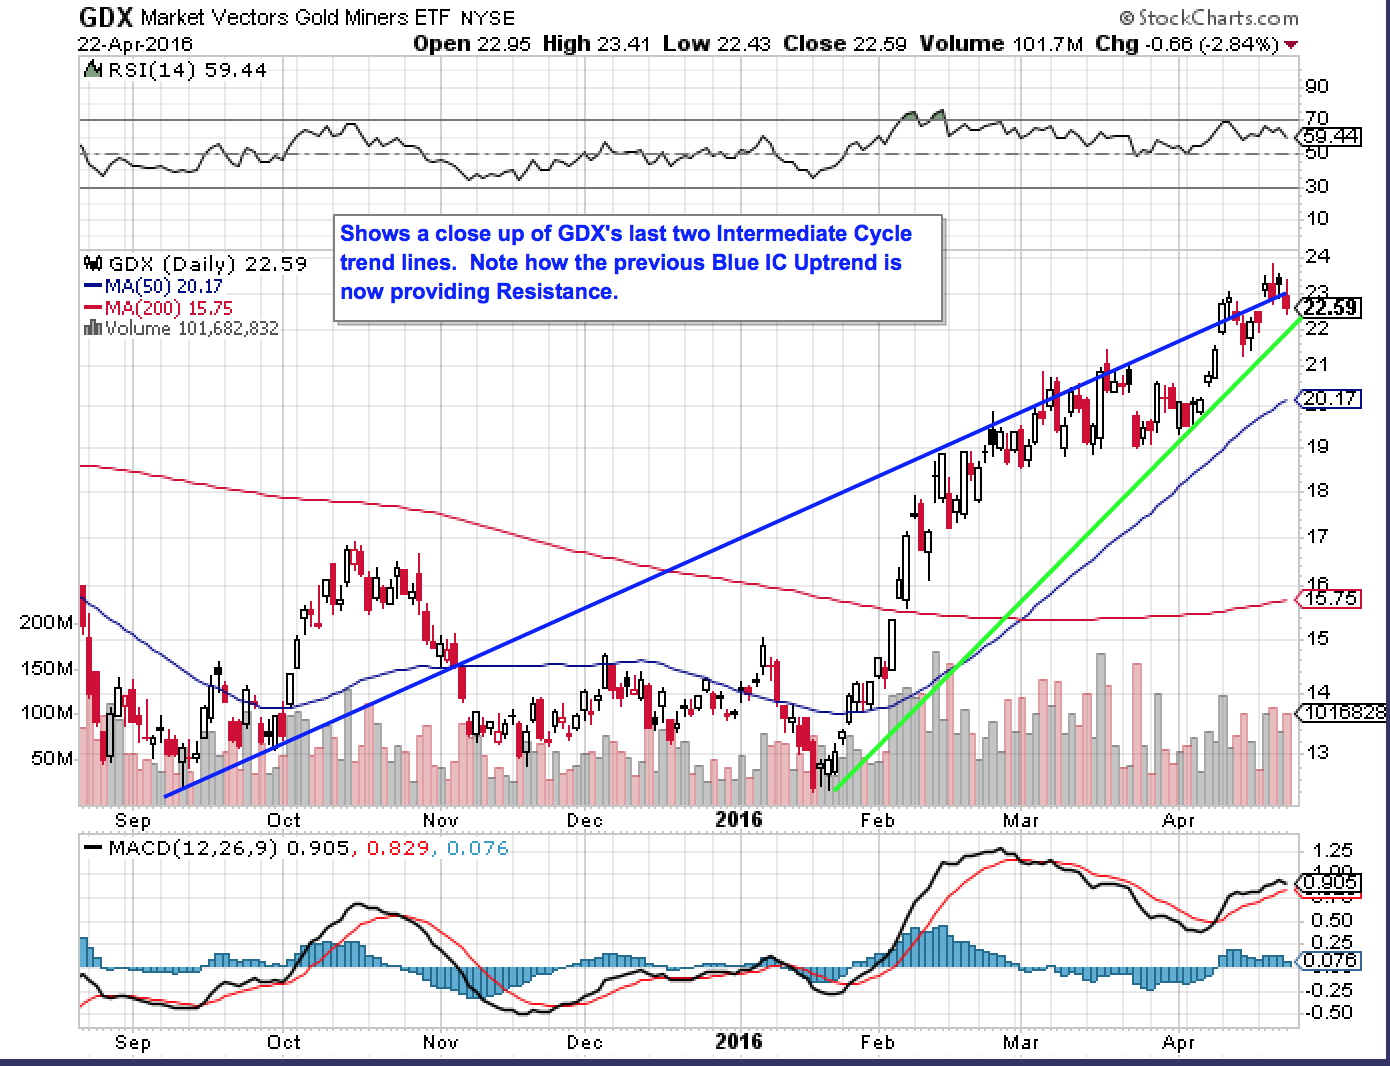
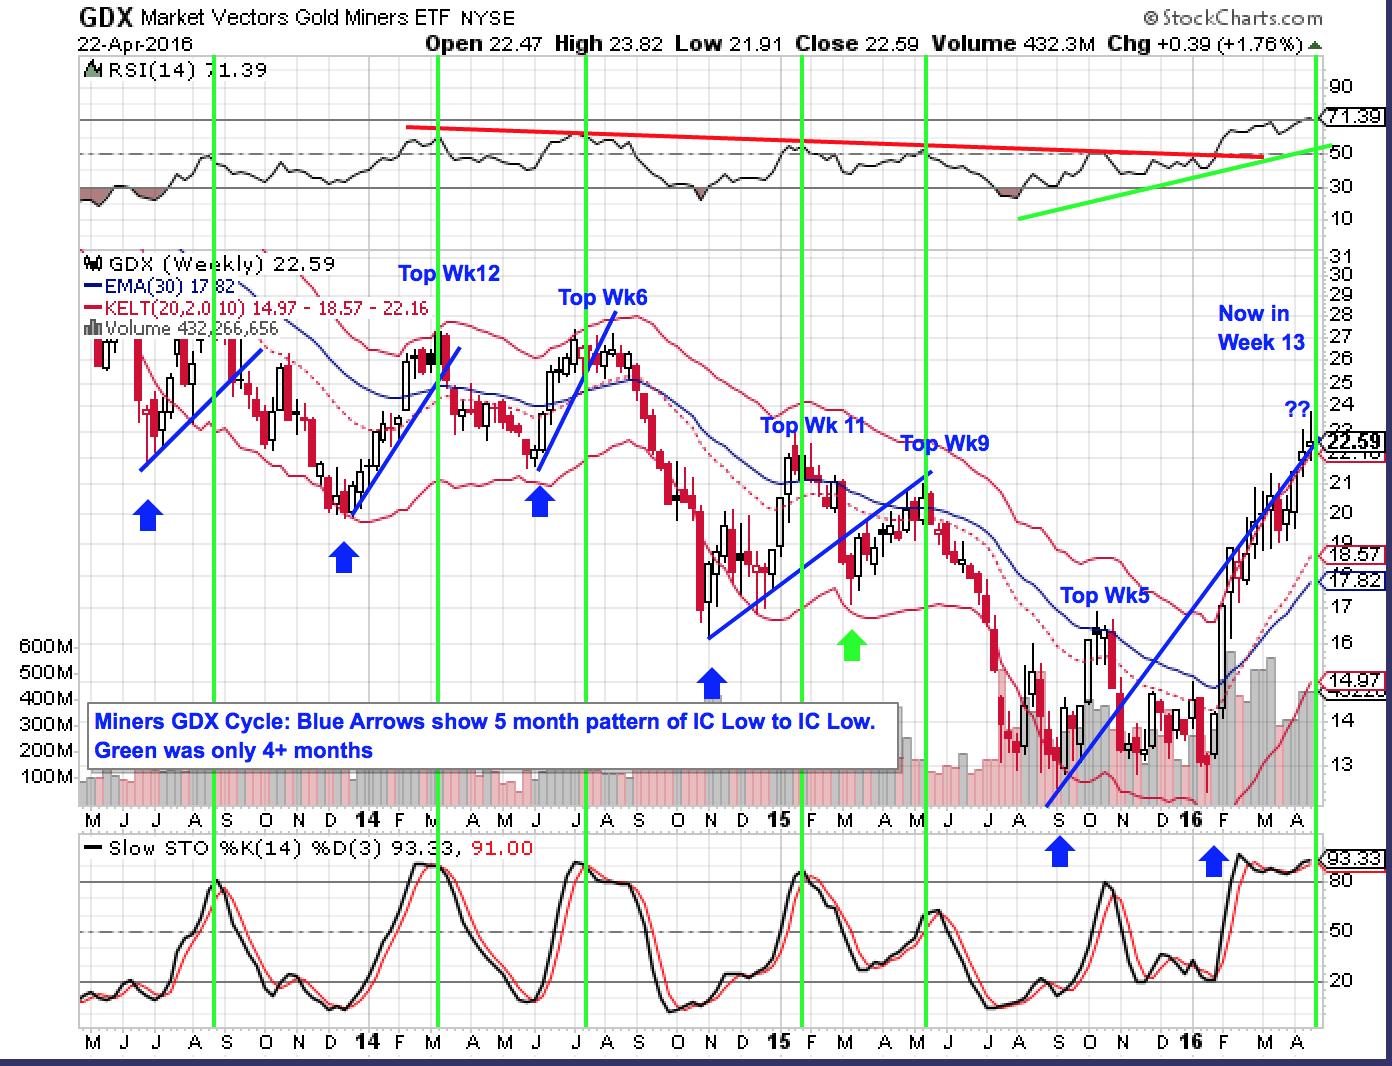
The last chart is a longer term picture of the last 4+ years of IC Lows for GDX. Note how once the Blue IC Uptrend line is broken, GDX moves into it’s next IC Low about every 5 months. Also note how GDX is still backtesting the previous IC Uptrend line.
Green Vertical lines show how Keltner Bands, Slow Sto and RSI similarities provide a clue at IC Tops. Lastly, the current IC Uptrend is very steep.