THE MOST HATED BULL MARKET IN HISTORY
RAMBUS HAS BEEN UPDATING THIS CHART EVER SINCE WE OPENED RAMBUS CHARTOLOGY…REMAINING LONG TERM BULLISH ALL THE WHILE….PO = 1400 BY 2030
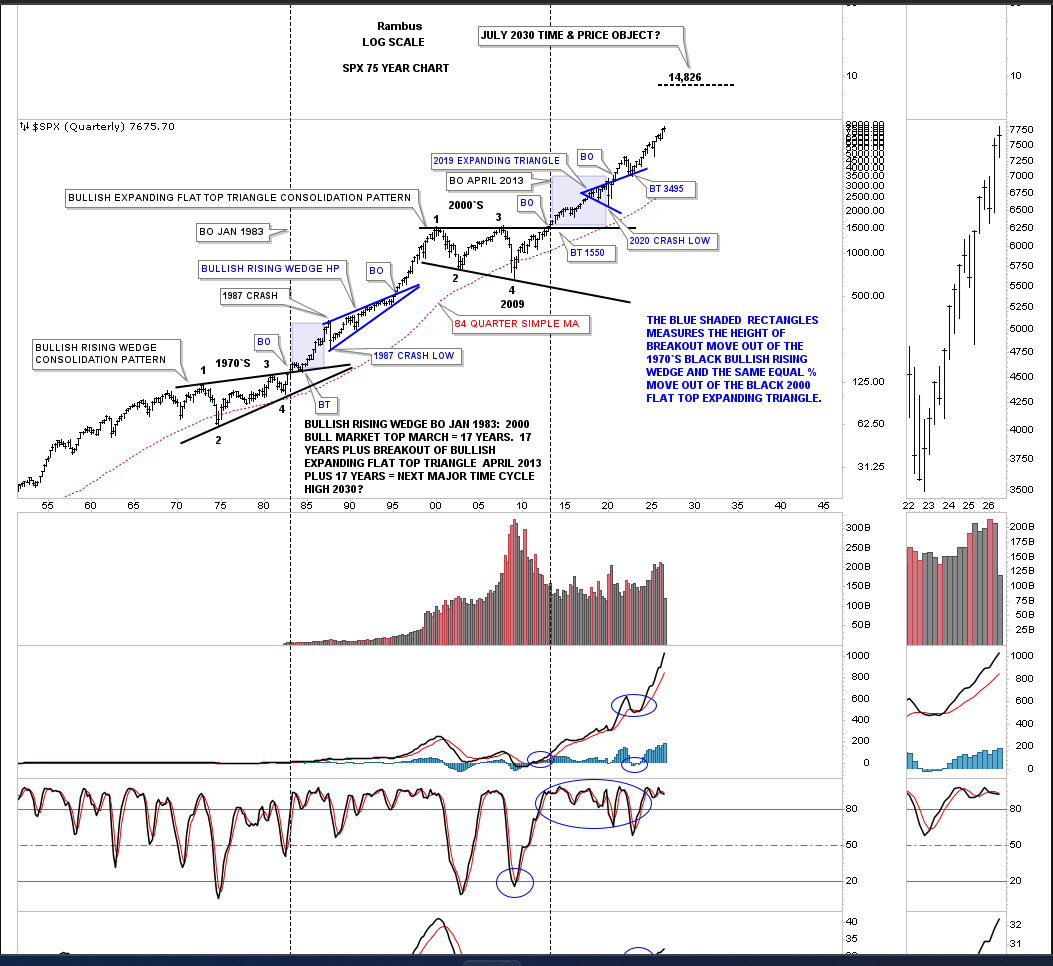
“We’ve been following this 75-year quarterly chart for the SPX, which shows the 1970’s to the 2000 secular bull market and the current secular bull market that began at the 2009 crash low, since the breakout of the 2000 flat top expanding triangle in 2013. From a time and price perspective, I’ve been mentioning that this current 2009 secular bull market could end in the early 2030’s area around the 14,000 area.
If you look at the thumbnail on the right sidebar, you can see with one more month of trading before the 3rd quarter is complete that the SPX is trading at a new all-time high. This is the most hated bull market in history, which has been climbing the proverbial wall of worry.”
……………..
THERE HAVE BEEN TOP CALLERS ALL THE WAY UP ALL DAY EVERY DAY….MANY MANY CALLS FOR A 1929 TYPE CRASH …SHORTS HAVE BEEN KILLED ( I KNOW FROM PERSONAL EXPERIENCE )…BUT THAT DOSN’T DETER THEM …THEY ARE GETTING LOUDER AND LOUDER..MAYBE A BLIND SQUIRREL ?? 🙂
I SUGGEST WE NEED A NAME CHANGE FOR THIS INDEX PRESIDENT TRUMP…THE PRESENT NAME IS COMPLETELY INAPPROPRIATE
THE STANDARD & POORS ?….WTF ?
HOW ABOUT THE AMERICAN STANDARD INDEX ?
HAS A NICE RING TO IT
quarterly charts are superb for getting your bearings.
the bull has been alive, as long as the macd stays above zero.
Its never pinpoint, but it works on your favorite timeframe as a first approximation of trend.
And its hated because its become exceptionally narrow.
Follow the lemmings, or lose out.
I wouldn’t call it the most hated bull market because frankly they all express this sentiment. It is just the always present wall of worry that a bull market climbs.
This 1912 cartoon drawn the year before creation of the Federal reserve says it all. Soon after women were encouraged to enter the workforce in the 70’s (more batteries), the biggest evidence I witnessed working for Fidelity was how default (no affirmative election) rules for 401k contributions evolved. Abolition of Glass Steagall during Clinton’s presidency and since has been nothing but a partnership of banking and government to increase the number of tax payers, funnel retirement savings into 401k’s (specifically the stock market via investment election default rules and age-based contribution mutual fund products), and construct laws that keep that money there for as long as possible (withdrawal penalties are there for YOUR PROTECTION).
https://www.reddit.com/media?url=https%3A%2F%2Fi.redd.it%2Fa937kdxs7rw71.jpg
The stock market has been the last bastion of confidence in the system since the GFC – and still climbing the wall of worry.