 Loading ...
VIX
For people who are worried about the market today, I get it. This stuff is very stressful.
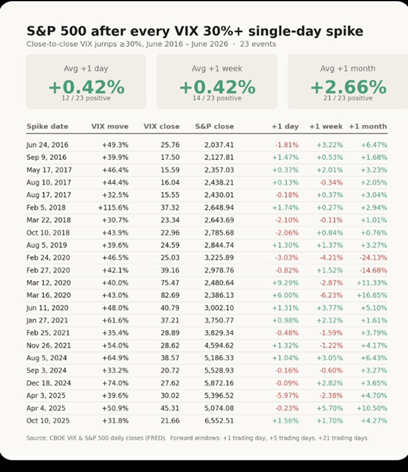
So I put together a chart of all of the times the VIX (the “fear index” of the market) was up over 30% in a day (like today) in the past ten years.
23 out of 25 instances the market was higher one month later. The only two times it wasn’t was Feb 2020 when Covid hit the economy in March 2020.
What is the underlying message? When people are afraid, they make bad decisions. Do the opposite.
Attached is a chart summarizing my results.
Every market event, for VIX, has a different context. Its crazy to lump them together in one pile.
IMO, this one for general equities is likely breaking down from a third wave top.
I say that because my HTF work “cannot” mark a final top here due to very elevated readings. (Just see AI)
AND, certain indicators view will still view this as Countertrend to that HTF work. (these are NOT and WILL NOT flip yet)
We “need” HTF divergences to mark a final top. At least more of them than I see now.
And more HTF sell signals that I don’t see yet. So yes, its not time to panic yet.
In the larger context, EVERYONE knows the implications of a wedging top.
Will that continue to build to form? Those collapse FAST when they do form.