Gold/Silver
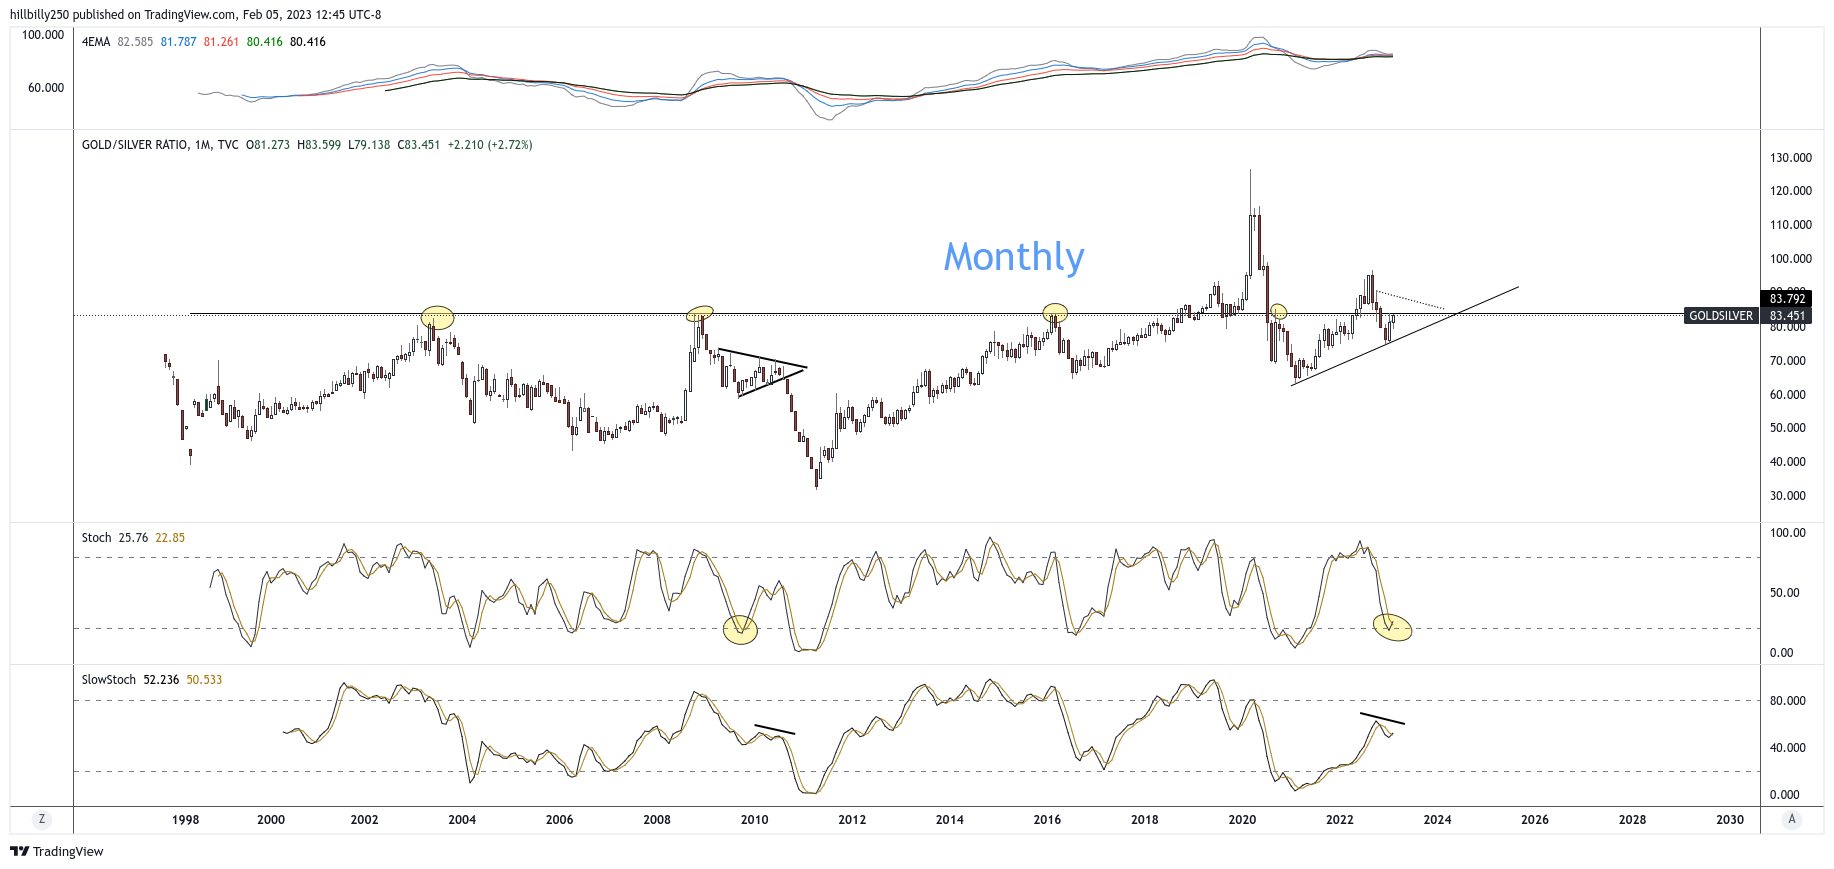
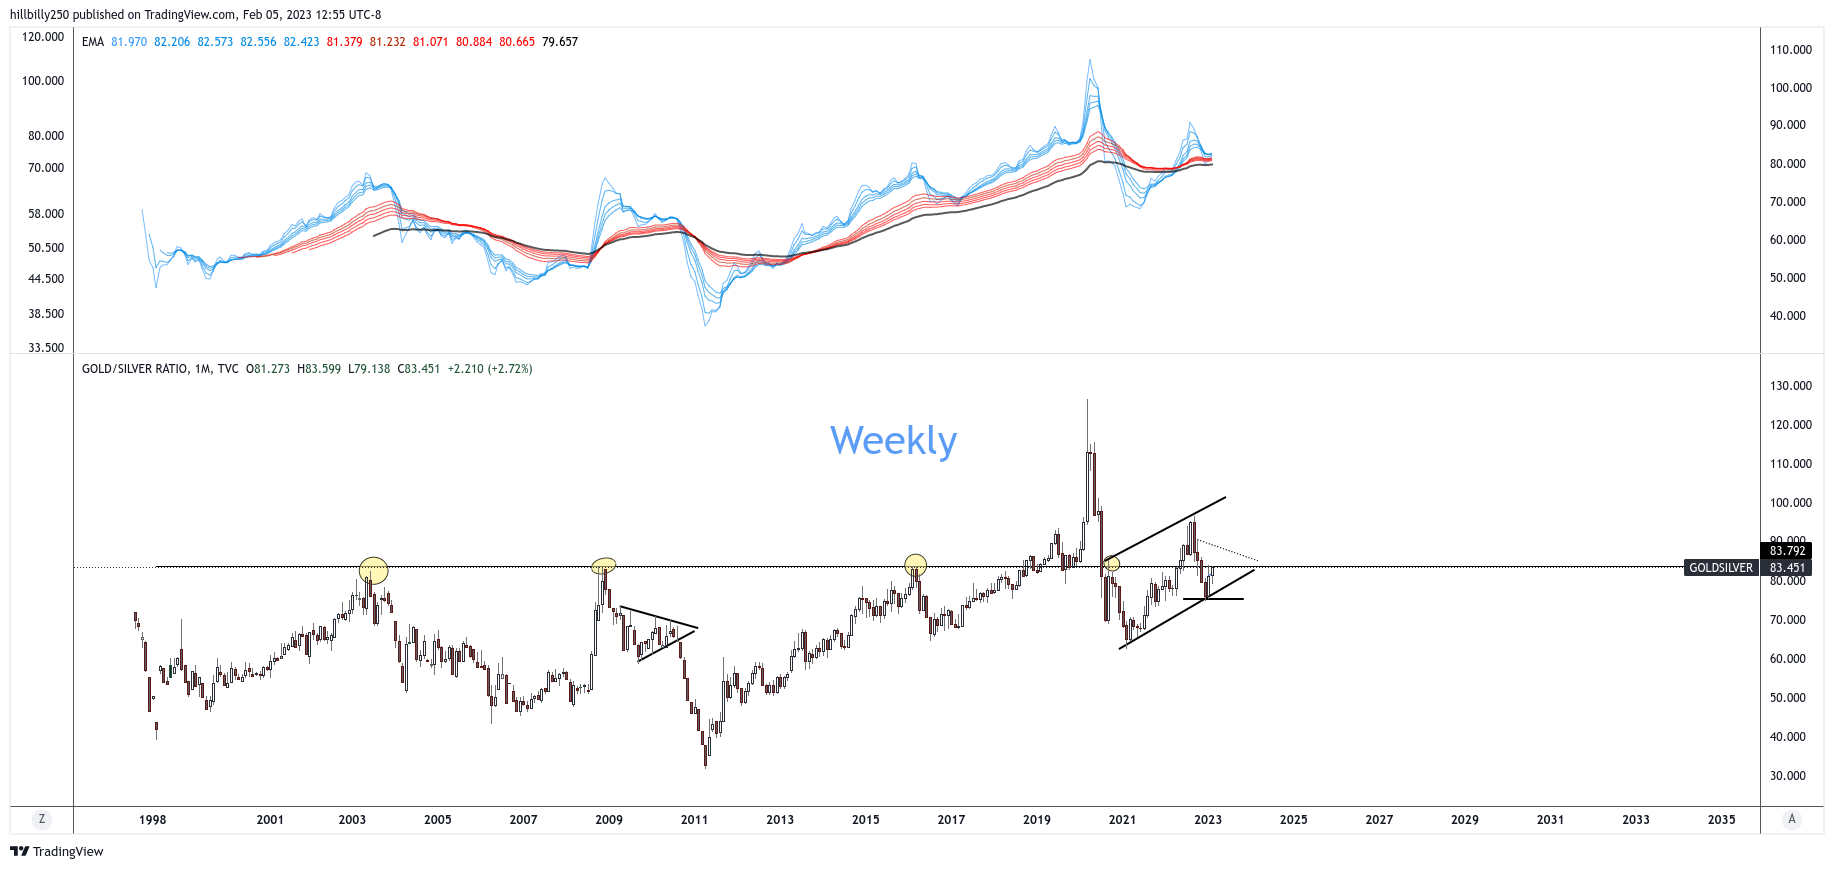
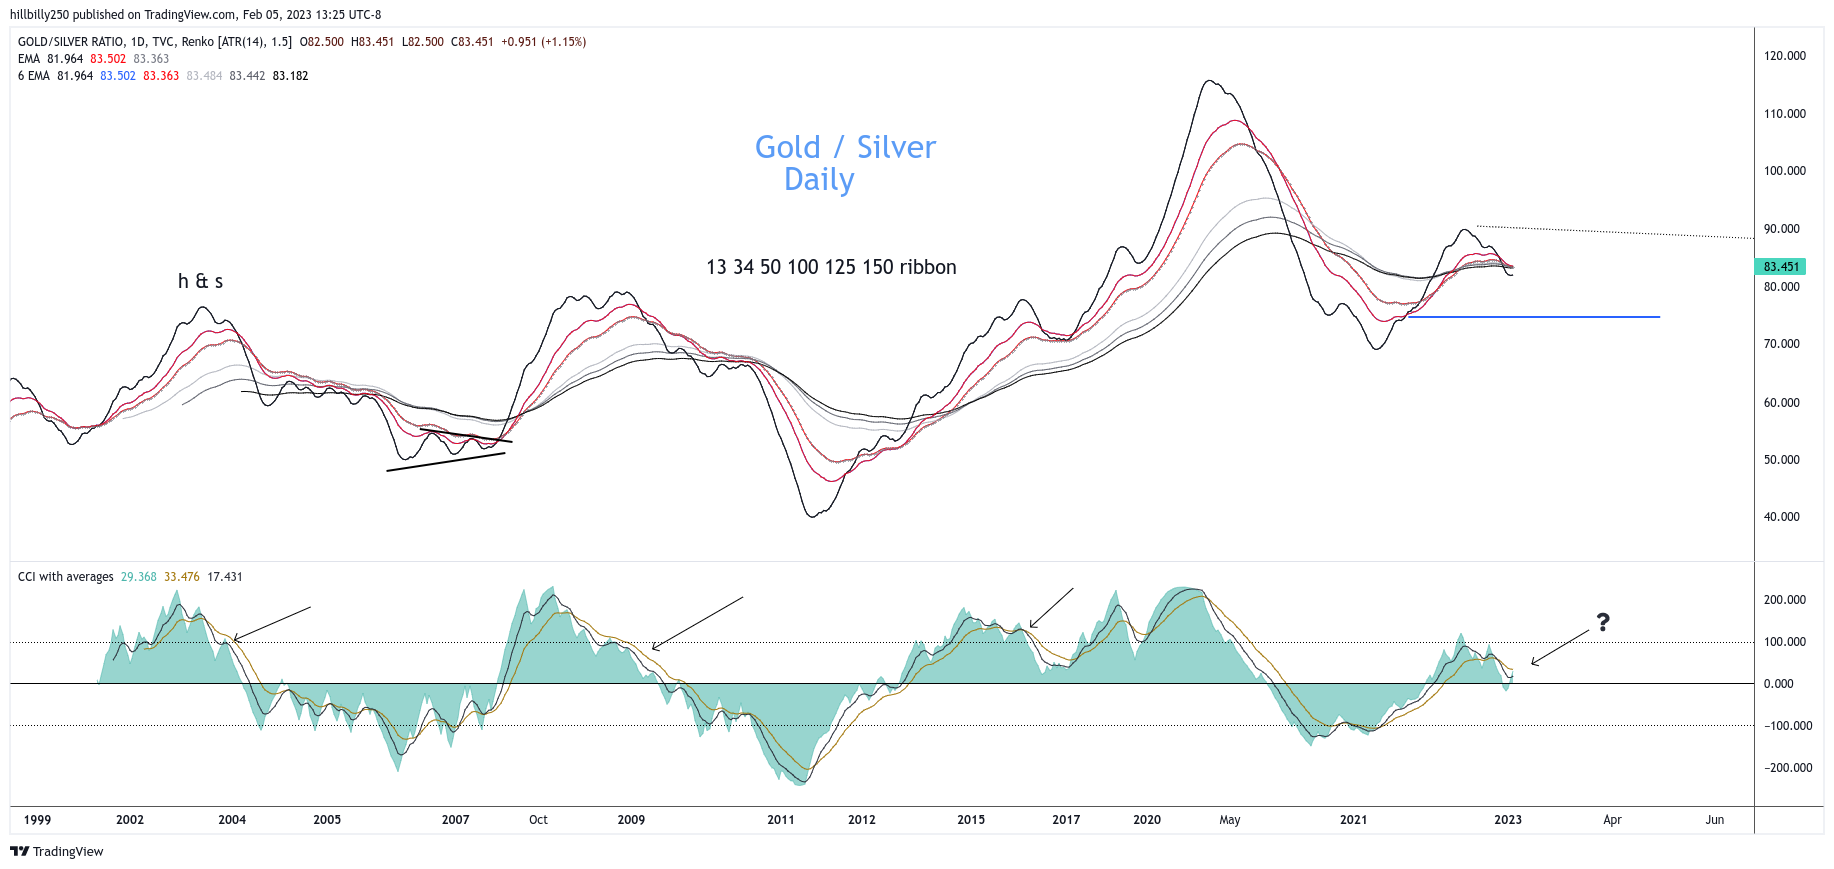

Monthly showing old levels of importance. 2nd chart showing the ribbon bounce on support c/w 3rd chart daily Renko long term ribbon possibility of bounce into resistance and drop. Last is daily H&S measured move to resistance. Chart 4 fits Nightingales’ and Armstrong notes.