Golden Cross For Gold
Having made a double bottom in March and April, gold rallied about 15% or $240 to it’s recent high point. The fact that it is pulling back about $70 is not only to be expected but is actually bullish. Looking at the chart you would expect that the rally, which took gold from below, to above, both the 50 day and 200 day averages and with the 50 day about to cross over the 200 day, would have a correction that would kiss or come close to the 200 day. That should occur either today or tomorrow and set up for the next leg higher going forward. Often times the golden cross occurs with the current price of a stock or commodity well above the mvg. averages and in an overbought position. This one occurs with gold having had it’s correction and testing the moving averages. Bullish and ready to resume it’s climb. 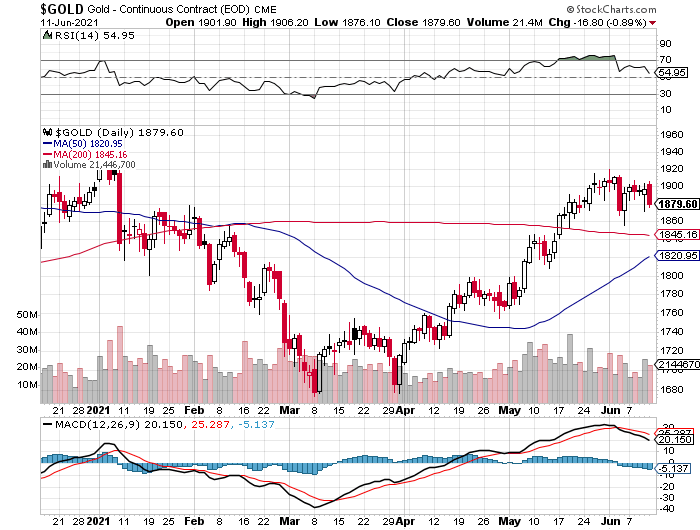
$1,850 gold and $37.40 gdx have been my re-entry targets (for trading around the majors position). I just hope they close the day around these points to let the gentlemen in. Thanks for the chart and notes CM!
Good call so far. We hit the 200dma and bounced.
Looking at the upward channel since the February low, this was a GDX pullback in time rather than price, intraday low was in fact $37.40. Today gold showed a hammer (low) – stop run 8:30-8:55am took out trades down to $1,845.70. Silver also got slammed right on time at the open only to be bought back hard above $28. Lots of technicals indicating at least a near term low in the PM space and the bull is likely to continue, if not tomorrow Wednesday. Looking forward to getting my WSS stickers for my upcoming road trip in July!