Silver fundamentals
Silver Institute Press Releases / SILVER INDUSTRIAL DEMAND REBOUNDED IN 2017; MINE SUPPLY RECORDED SECOND CONSECUTIVE LOSS
SILVER INDUSTRIAL DEMAND REBOUNDED IN 2017; MINE SUPPLY RECORDED SECOND CONSECUTIVE LOSS
- Posted on04 12, 2018
(New York City – April 12, 2018) Industrial demand for silver, fueled by record photovoltaic growth, rose in 2017 for the first time since 2013. A stronger global economy led to healthy demand from the semi-conductor market, resulting in greater silver offtake in electrical and electronics applications as well as brazing alloys and solders. The jewelry and silverware sectors also experienced noteworthy gains in 2017. On the supply side, global mine supply fell for the second consecutive year, following an uninterrupted streak of 13 annual increases prior to 2016. Silver scrap supply, which has been in retreat since 2012, again registered a loss. These factors led to a tightening of the supply/demand balance, contributing to a physical deficit of 26 million ounces (Moz) in 2017, the fifth consecutive annual deficit.
These findings, along with other key segments of the silver market, are discussed in World Silver Survey 2018, released today by the Silver Institute and produced on its behalf by the GFMS Team at Thomson Reuters (GFMS).
 Silver Industrial Demand
Global silver industrial fabrication demand returned to growth in 2017, increasing 4 percent to 599.0 Moz. This was the first rise in silver industrial fabrication since 2013. This growth was bolstered by another year of impressive photovoltaic demand, rising 19 percent in 2017, the result of a 24 percent increase in global solar panel installations. Brazing alloy and solder silver fabrication recorded a 4 percent annual rise to 57.5 Moz, boosted mainly by solid growth from China and Japan.
The surge in electronics, most notably in semi-conductor fabrication demand, led to the electrical and electronics segments delivering the first annual increase in offtake in this category since 2010, with 242.9 Moz consumed last year. Silver demand for the production of ethylene oxide retreated by a third from 2016 volumes to 6.9 Moz, mostly due to a decline in new installations. GFMS estimates that silver’s use in photography, which fell by 3 percent last year to 44.0 Moz, appears to have stabilized, with renewed interest in various photographic applications utilizing silver, only falling marginally over the last few years.
Silver Jewelry and Silverware Demand
Silver jewelry demand moved 2 percent higher in 2017 to 209.1 Moz. India was chiefly responsible for the gain, rising 7 percent over 2016 volumes. Demand also picked up strongly in North America, with the United States posting a 12 percent rise to an all-time high. Global demand for silverware jumped by 12 percent last year to 58.4 Moz, led by a strong recovery in demand from India, which experienced a 19 percent increase. North America also posted solid gains, rising 5 percent to 1.6 Moz.
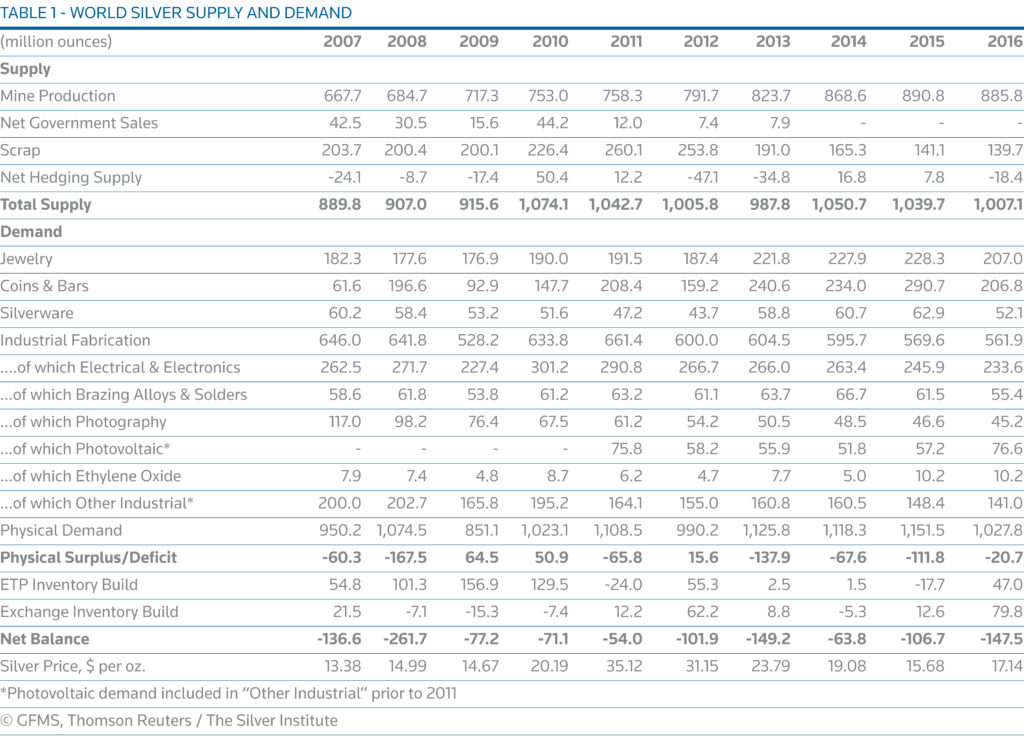
World Silver Supply and Demand (million ounces)
(totals may not add due to rounding)
Supply
| 2016 | 2017 | |
| Mine Production | 888.6 | 852.1 |
| Net Government Sales | – | – |
| Scrap | 139.7 | 138.1 |
| Net Hedging Supply | -18.9 | 1.4 |
| Total Supply | 1,009.4 | 991.6 |
Demand
| 2016 | 2017 | |
| Jewelry | 205.0 | 209.1 |
| Coins & Bars | 207.8 | 151.1 |
| Silverware | 52.4 | 58.4 |
| Industrial Fabrication | 576.8 | 599.0 |
| …of which Electrical & Electronics | 233.9 | 242.9 |
| …of which Brazing Alloys & Solders | 55.3 | 57.5 |
| … of which Photography | 45.2 | 44.0 |
| … of which Photovoltaic* | 79.3 | 94.1 |
| … of which Ethylene Oxide | 10.2 | 6.9 |
| … of which Other Industrial* | 152.9 | 153.7 |
| Physical Demand | 1,041.9 | 1,017.6 |
| Physical Surplus/Deficit | -32.5 | -26.0 |
| ETP Inventory Build | 49.8 | 2.4 |
| Exchange Inventory Build | 79.8 | 6.8 |
| Net Balance | -162.1 | -35.2 |
| Silver Price, $per oz. | 17.14 | 17.05 |
*Photovoltaic demand included in “Other Industrial” Prior to 2011
Silver Supply
Global silver mine production fell by 4.1 percent in 2017, experiencing its second consecutive annual decline to record 852.1 Moz. The decline was mainly credited to a series of supply disruptions across the Americas. Another leading factor in the drop was due to the primary silver and gold sectors, where production fell by a combined 29.4 Moz. Of the key producing countries, Peru and China registered subtle dips, followed by more acute losses in Australia and Argentina. Offsetting those losses was higher output from Mexico, which was once again the world’s top silver producing country, trailed by Peru, China, Russia and Chile.
Supply from primary silver mines decreased by 9 percent in 2017 to contribute 28 percent of total mine supply. The lead/zinc sector contributed 36 percent of by-product output, followed by copper at 23 percent and gold at 12 percent.
Silver scrap supply fell to 138.1 Moz, marking its sixth successive yearly decline. Lower scrap flows from Asia, mainly China, driven by a lack of incentives from both suppliers and consumers to recycle their valuables, is chiefly responsible for the fall. Supply from the western world was marginally higher, driven by increased volumes from the United States and Europe.
Above-ground stocks rose 3 percent last year. Of the four exchanges that report silver stocks, three saw total silver inventory growth of 2 percent in 2017; COMEX in the United States, the SHFE and the SGE in China. In contrast, silver inventories held at TOCOM declined dramatically by 98 percent, driven by strong industrial demand in Japan.
GFMS reports that government sales of silver were once again absent from the silver market in 2017. Lastly, in the supply category, the delta-adjusted hedge book inched higher by 1.4 Moz, ending last year at 21.5 Moz.
Silver Price and Investment
The annual average silver price fell by a slight 0.5 percent to $17.05/oz last year, with prices trading in a $15.22/oz – $18.56/oz range. That said, last year’s average silver price represents an 8.7 percent increase over the average posted just two years ago of $15.68/oz.
Identifiable investment, which consists of net-physical bar investment, coins and medals purchased, and net-changes to exchange traded product (ETP) holdings, reached 153.5 Moz in 2017 a 40 percent decline from the previous year. This was primarily the result of a 35 percent decline in coin and medal fabrication, led by lower demand in the United States, Canada and China. Physical bar demand slipped by 16 percent last year.
In contrast, total global ETP holdings increased by 2.4 Moz to finish 2017 at 669.8 Moz. In value terms, total ETP holdings increased 4 percent to $11.3 billion, as the silver price advanced throughout the year.
About the World Silver Survey, the Silver Institute and Survey Ordering Information
The Silver Institute has published this annual report on the global silver market since 1990, to bring dependable supply and demand statistics to market participants and the public. The 28th edition of the Silver Institute’s World Silver Survey was independently researched and compiled by the GFMS team at Thomson Reuters. World Silver Survey 2018 was sponsored by 20 companies and organizations from North and South America, Europe and Asia.
Copies of World Silver Survey 2018 are available to the media upon request, and a PDF version can be downloaded from the Institute’s website at www.silverinstitute.org. In North America, hard copies may be purchased by the public from the Institute’s website; for copies outside North America, please contact the GFMS team at Thomson Reuters via GFMS@thomsonreuters.com.
Here is an interview discussing this press release…
Thanks very much JSK
This is the most important take away for me
Demand
Jewelry …………….. 209.1
Coins & Bars ………… 151.1
Silverware …………… 58.4
Industrial Fabrication .. 599.0
TOTAL…………………1,017
Coins and Bars are only 15% of the Total Demand in 2017
And that’s down from about 20% in 2016
Silver is an Industrial Metal Primarily !!
Fully, I agree when you look at these numbers for coins and bars from this report it is showing investor demand has fallen. Click on the chart and look at the coin and bar column since 2007 the numbers are moving up and down like a yo-yo so there is no trend here, IMO. also I believe that the survey does not include private mint coins and bars so this is not a very reliable number when using it to understand the complete demand for silver. What I believe is the most important numbers are mining supply and scrap recycling. If price does not move up and stay up then supply will continue to fall.
ps. the darnedest thing Fully, when I try to use the link for Logout/write a post my computer will not use them but it simply refreshes the page. In the recent past those links worked perfectly. So I don’t know if it is my computer(older macbook pro) or what?
clear your cookies
America Silver Corp rep stated on Kitco interview they would rather leave the $hit in the ground than deplete there reserves at these $Silver prices. moved mine production toward Zinc and what not instead. drop in ounces mined may be that scenario being played out across the field rather than peak Silver which is beat to death when ounces decline YOY?