For Gary ’76-’80 Dow/Gold + Silver
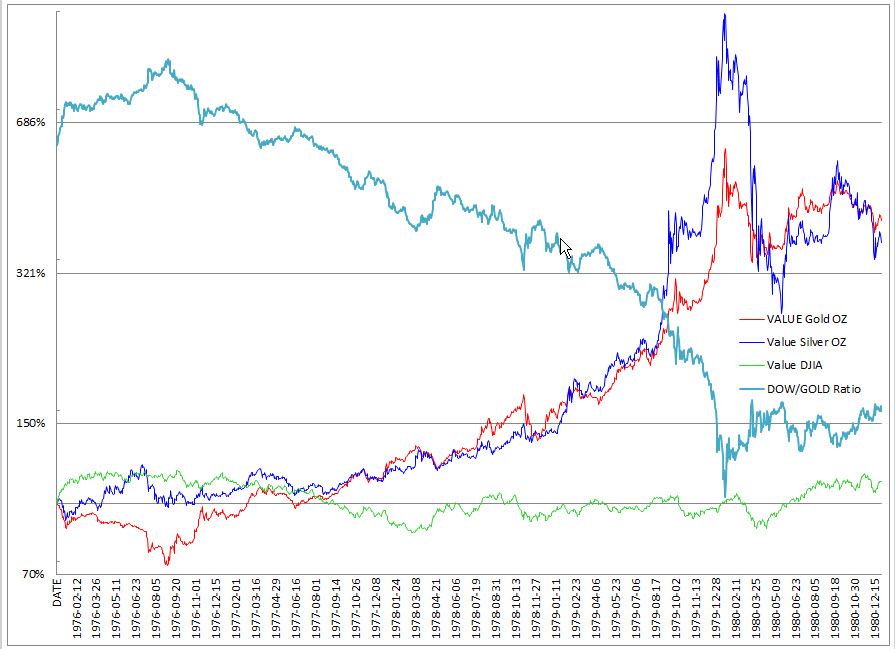
This is a daily chart I constructed manually a year ago.
This is roughly how I foresee things developing over the next 7 yrs or so.
Full timeline – AU/AG/DJIA indexed at 100, DGR @ around 6.5 falling to just over 1.0
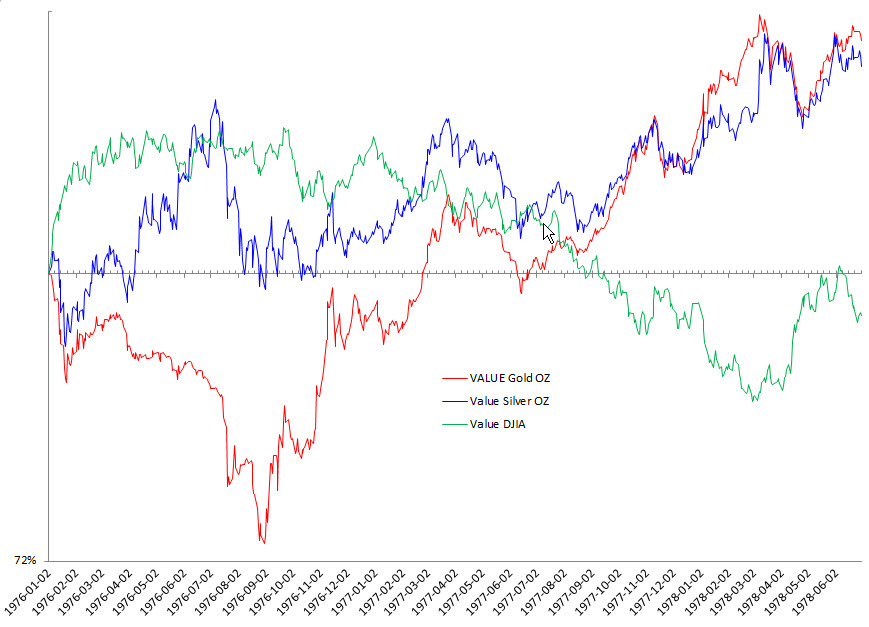
First 2.5 yrs – missing DGR (scaling), AU/AG/DJIA indexed at 100
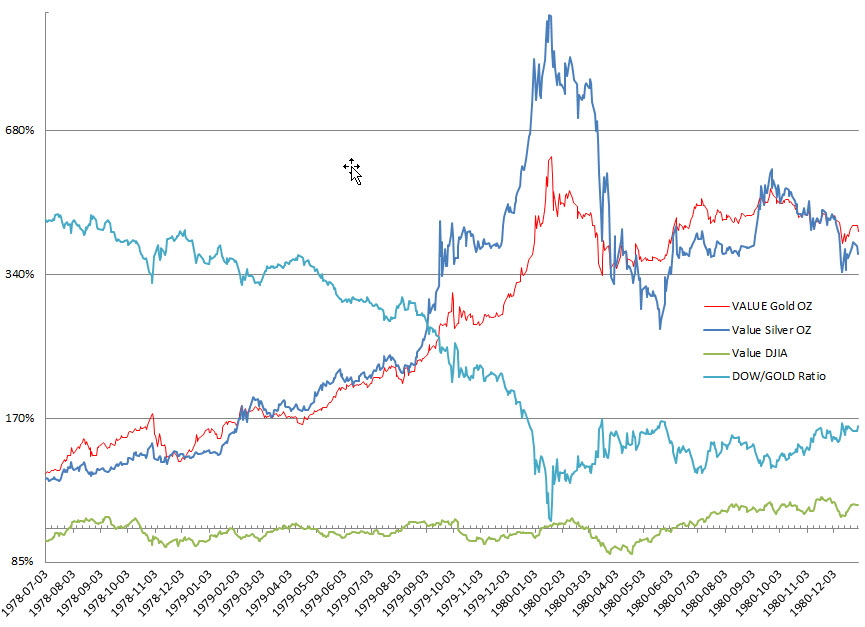
Last 2.5 yrs (continued from above)
Thank you. Do you know of a gold stock index/ chart from 1968 – 1980 or even 1971 – 1980?
https://www.goldbroker.com/news/gold-vs-barron-gold-mining-index-bgmi-498
http://www.kitco.com/ind/Trendsman/2015-04-24-Are-Gold-Stocks-the-Cheapest-Ever.html