GDX-weekly
Find here my GDX weekly. IMO – as long as price is below the little BLACK HORIZONTAL line, I consider GDX in progress of creating a right shoulder while in BT-mode the HEAD from below.
The charted CYCLES gives the complexity for GD going forward. Bear with me … while the little PURPLE CYCLES sets the standard; the question that arises is: how many LITTLE PURPLE CYCLES are within one LARGER cycle? Either 3 or 4. With 3 little purple cycles, a larger Purple cycle is created and seems to give a perfect match while 4 little purple cycles, gives us a larger Green cycle is created and seems to give probability. The difficulty lies with seeing forest for the trees while there are Cycles within Cycles.
Only when looking at GDX … I would give odds for the LARGE PURPLE CYCLE going forward.
Nevertheless . . . I take currencies into account. As I have posted (before) my long term charts for both EUR and USD giving odds for a turn both 2025 and 2027 . . . I decide to choose for the LARGER GREEN CYCLE.
IMO – when in trading . . . one should Trade with a Plan; above is my Trade Plan.
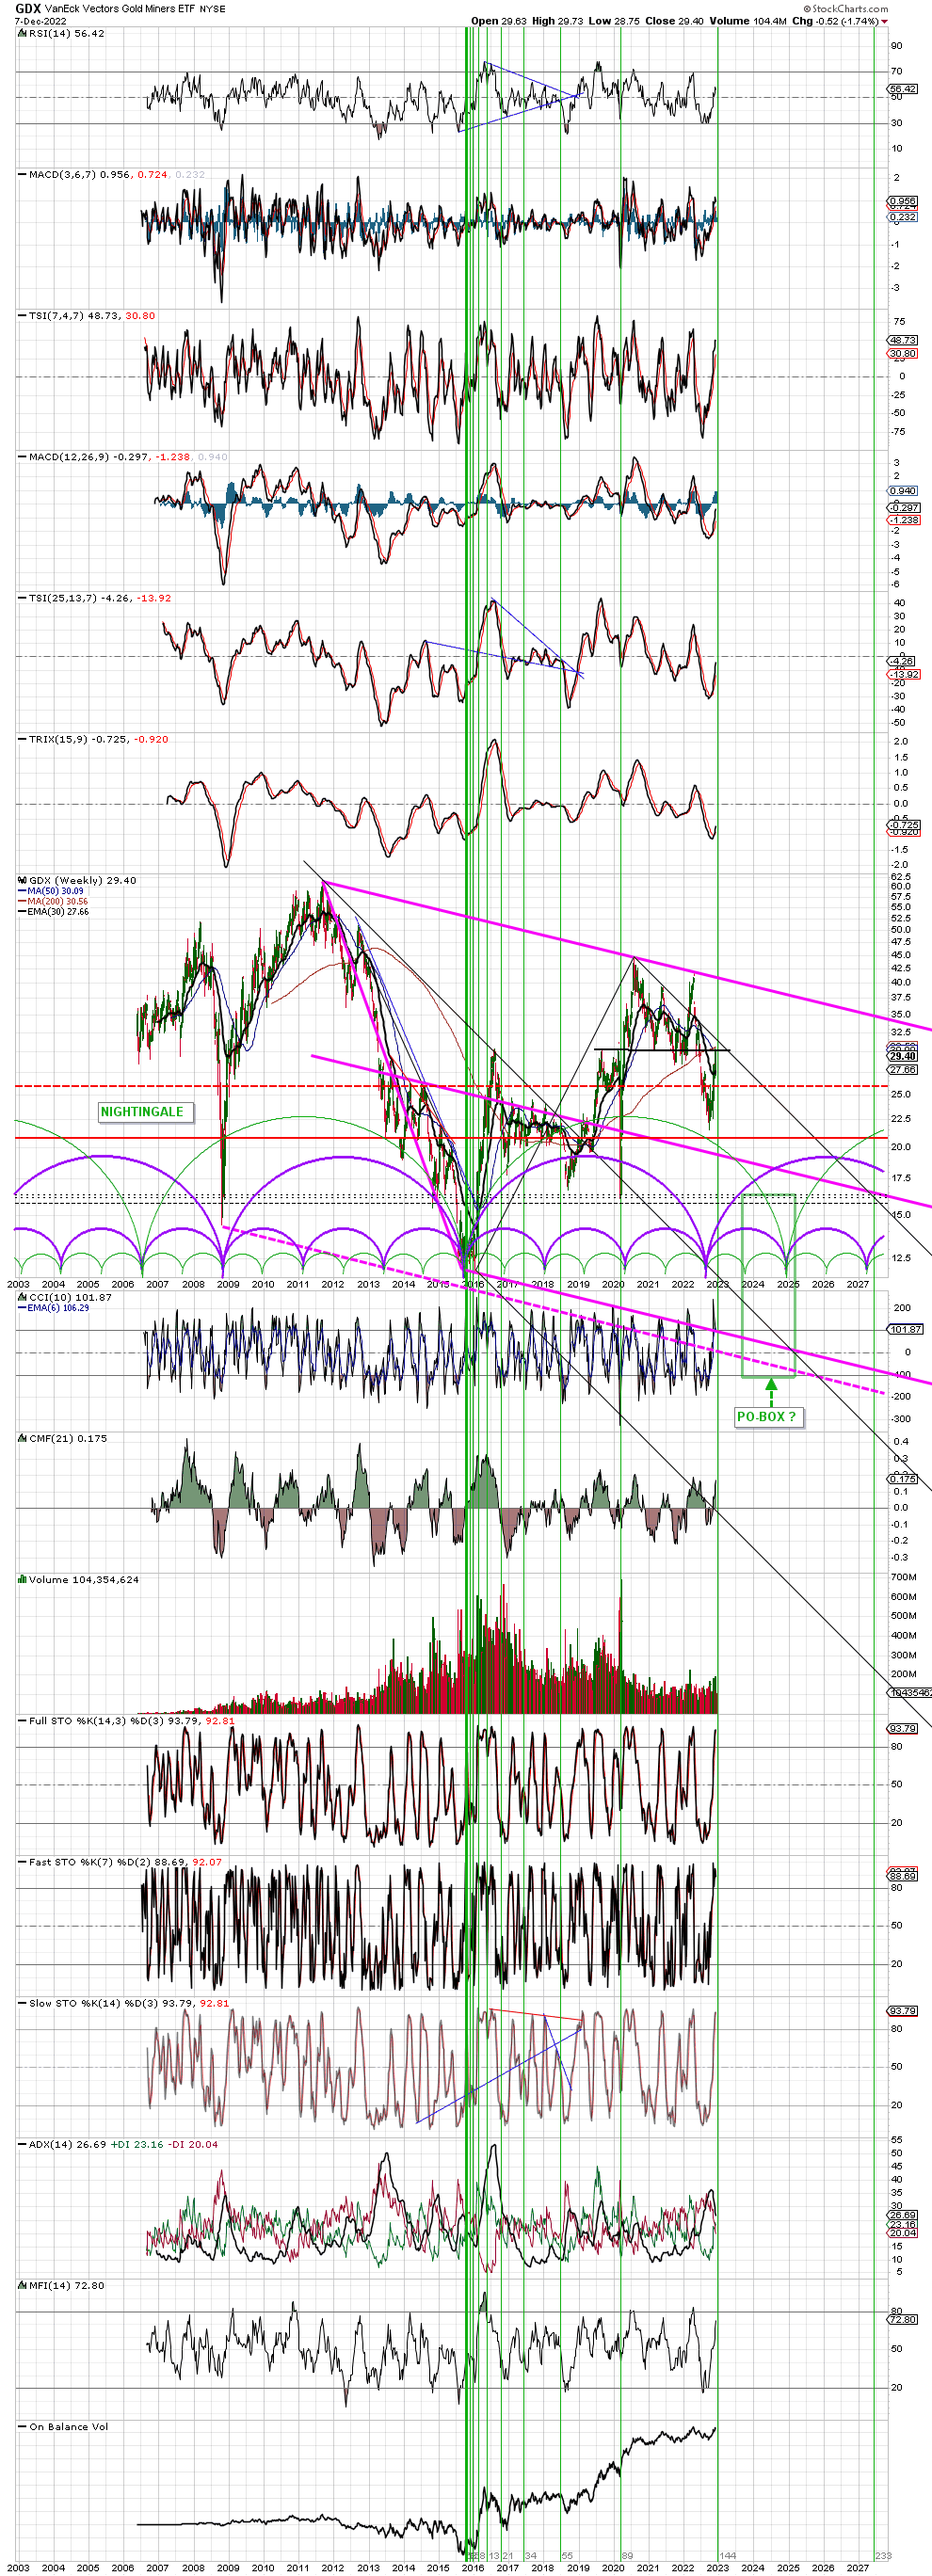
Interesting note: the next vertical FIB TIME is around 19th December – see GREEN VERTICAL lines. As this is a weekly LT-chart, the 19th-date need to be taken +/- 1-2 weeks. Therefore an intermediate turn is due THIS MONTH (maybe first week January).
Wow….a Cyclefest
Thanks Nightingale…Impressive work.
I might be loosing my charting edge because i cant make heads or tails out of pedro’s (small p ) charts and now I am having trouble seeing if you are bullish bearish or neutral ?
Please let us know
Seems like she’s bearish.
Cyclefest … hahaha, I like it.
Oke, as for answer to your question:
1 – see PO-BOX (drawn within the chart: check it and you see it) as for Price Objective area / while TIME progress and we come closer to the cycle-turn, we are more able to target precisely .
2 – I set the GREEN CYCLE with a HARD-LOW incoming (end-24/begin-25).
The answer is BEAR until end-24/begin-25 from when a FENEX arises. And before the FENEX, I expect an incoming HARD CRASH into the ashes (of potentially ALL paper markets) first.
On second though that inverse head and shoulders would be wildly bullish.
“thought”