pedro’s sector assessment and tire kicking list – for June ’21
Even though I trade mostly leveraged ETFs, I track nearly 700 CA traded miners. (Weekend reviews only.)
(That may change at some point, after the next major washout.)
The weeds give me a clearer picture of what’s going on in the periphery. And in micro sectors like Rare Earths.
I don’t buy breakouts. I don’t trade off daily charts. I get more interested when I see blood in the streets per the LT charts.
These issues were OS on my monthly charts in May, and then bounced in some fashion in June.
These are not trading recs. There may be errors if I missed a split adjustment, etc.
They are offered up in case folks want to bargain hunt.
Yes they are color coded.
Green means bullish in all major timeframes …. the upper section HAS BEEN strong. The lower greens had been weaker.
Reds are still bearish. Dead cats, effectively.
Orange are on sell watch.
Blues … maybe.
I’ll try to post one of these late each month, if folks like ’em.
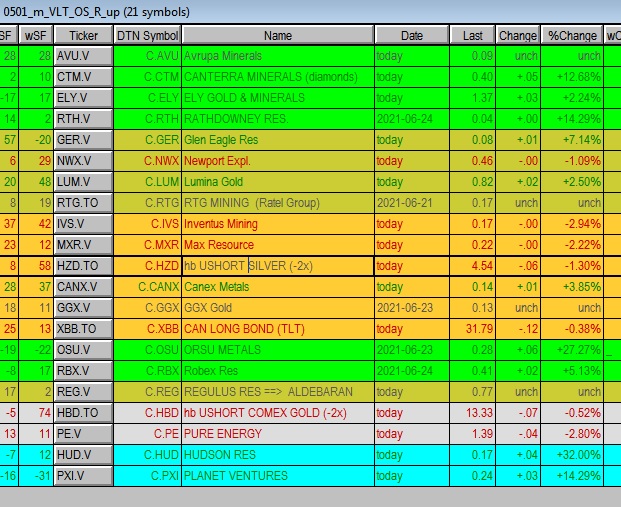
Quick review … see Lumina, HZD, HBD. I don’t expect HBB bounce to last long.
Impressive Pedro
Yes I’ve been in Micro miners for years and I never heard of any of these
ha
Very interested in regular posts and I haven’t heard of most of these either!
Are these sorted in any particular order — ie greatest to least potential or most to least blood on the ground etc.
green … bullish
olive mostly bullish
grey .. NML
blue … worth a shot; short leash
yellow … dead cat, should roll over
pink … twitching
red … dead
orange …bullish but at risk of trend change