Gold cycles
This first chart shows the currently dominant cycle with length=44 in gold. It is the pink line below the line graph of gold shown in blue. The next top for this cycle is in 12 days around March 1st, and the next low is around 34 days from today, around March 22nd. 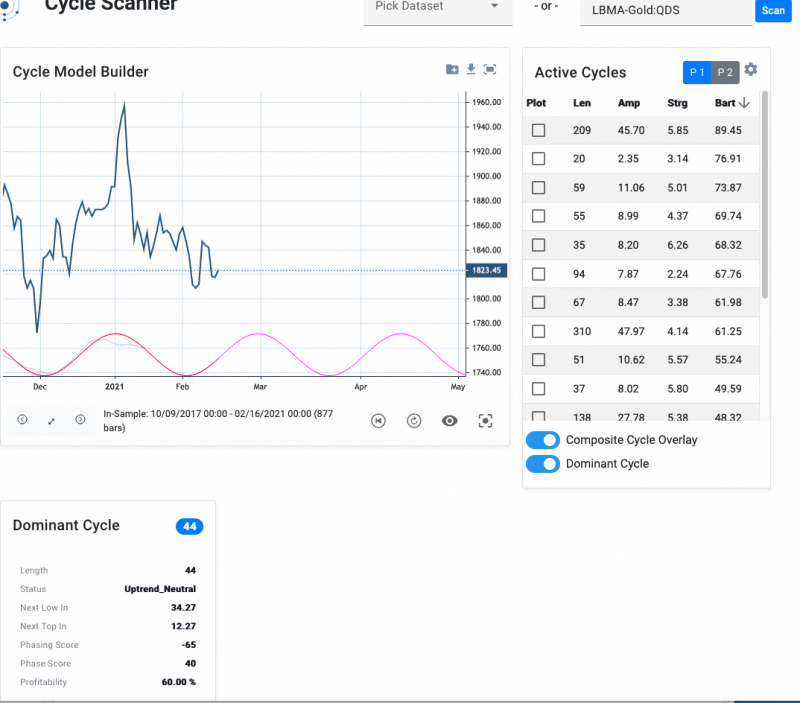
This is not the only cycle affecting gold. There is also a number of repeating cycles that combine to give the overall appearance of the gold chart. Selecting the most reliable of these, indicated by a high Bartel score, will mimic the gold price chart much closer and looks like so for the shown cycles selected: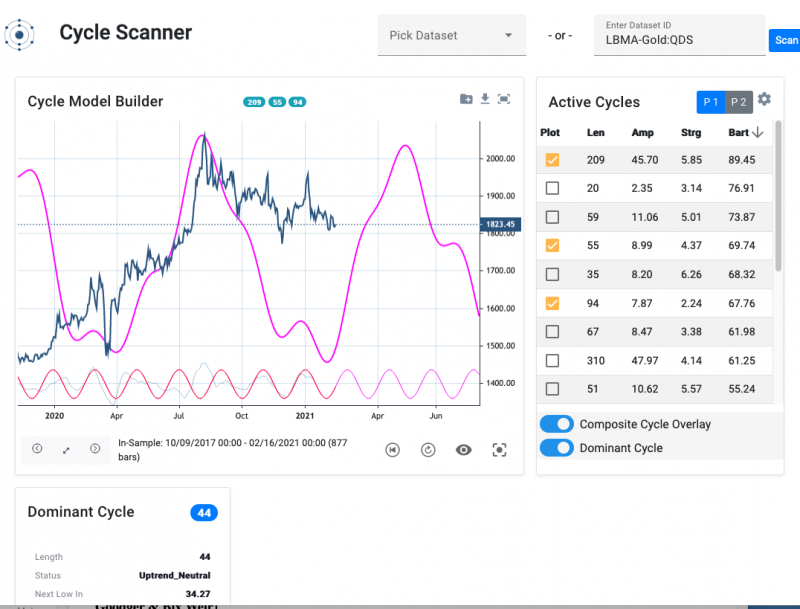
The top in this cycle appears to be April 30th. Of course, painting the charts will cause the price to not follow the repeating combined cycle projections in the future, so beware of this highly questionable forecast!