Dow/Gold Ratio Appears to Have Topped in October 2018
Please see this post from August 2018 where I suggested this ratio should not see a sustained breakout above 21. While it did poke its head above that level for a few weeks, topping around 22.35 in October 2018, it could not sustain it and broke down again.
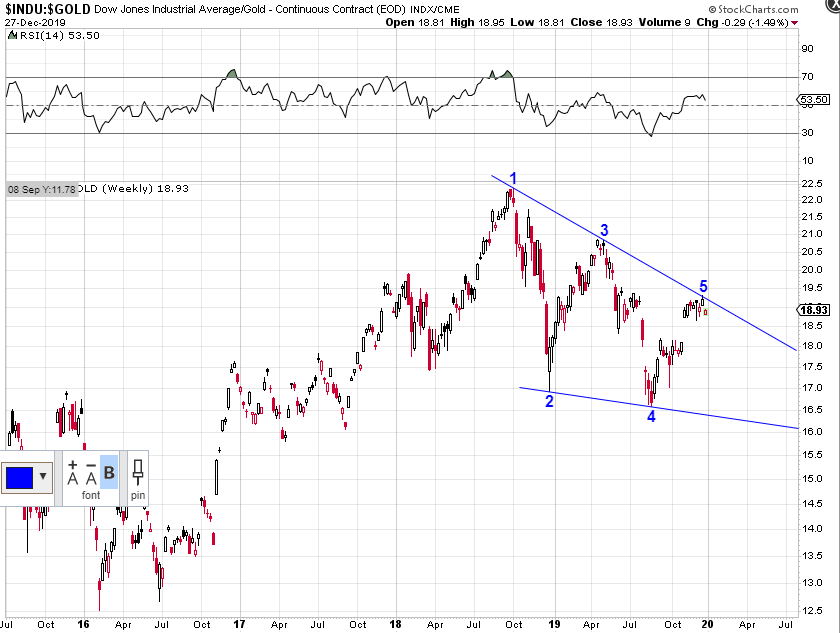
My view is that October 2018 was a generational top for this ratio, and it has now formed a wedge reversal pattern, which should resolve to the downside sometime in 2020.
The two previous secular lows in this ratio were in 1933 and 1980. Continuing with this timeline would place the next low somewhere around 2027. The historical expectation for this ratio is that it will drop to 1 or 2. So if, the Dow were to simply go sideways for the next seven years, gold could reach $28,000 per ounce. Given the inflationary leaning mindset that the Fed has adopted over the past year, I actually think the Dow will rise substantially over the next seven years, giving us an even higher price for gold (and eventually everything else we buy).
I know some think this is absurd. However, just remember that this is the ultimate long term scenario brought about by perpetually expanding credit and providing liquidity in order to have a perpetually booming economy, and a continuously rising stock market. Cheers.