For Schism
And anyone else who wants to know how I use cycle theory. I’ll be honest – I find cycles on the timescales of days and weeks very hard to analyse. I’ve tried, but I can often only make sense of it with hindsight. All the A-B-C’s and 1-2-3’s seem very hard to predict ahead of time. Even amongst Elliot Wave followers there are often differences of opinion. It doesn’t really matter to me though, because my game plan doesn’t rely on any of that. All I want to know, is which way the big trading patterns will break. The 8 and 16 year cycle lows coincided during late 2000/early 2001. The 8 year cycle bottomed in 2008 and then they both coincided and bottomed again 2016. The next 8 year cycle low is in 2024, and then they coincide again in 2032.
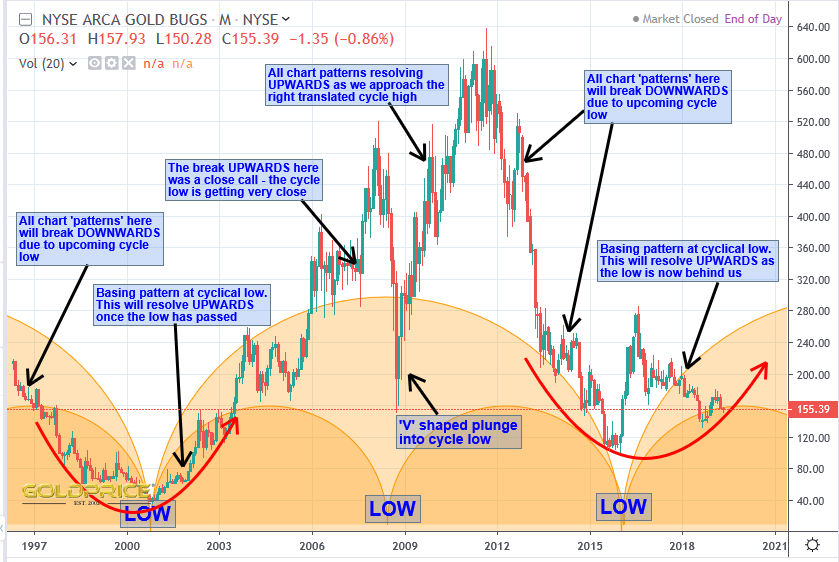
So, knowing all that, we are pre-warned about which way the ‘trend’ is likely to be over periods of several years at a time. I wouldn’t go so far as to say it’s 100% guaranteed (just because predicting the future never comes with 100% certainty – as a weather forecaster, I’ve learned that over the years). That said, you can use the balance of probabilities to make an informed decision about what the future is most likely to look like. In this case, we are most likely to see PM’s trend upwards until we turn down to make that 2024 low. When will it turn down ? that depends on whether we have a left or right translated cycle. This is why I read everything the cycles experts like Surf, Rambus etc write, and place that alongside the chart patterns I’m following. I’ll sell all my PM shares at this downturn. When we turn up again after 2024, I intend to be all in again, and sell as we make that big turn and head down into the low in 2032. If it works out, you’ll be able to find me on a tropical beach with a nice cold beer in my hand after that. The chart below helps explain how I view things on these timescales…
Over time, one learns which investing horizon appeals to them the most. Like you, I prefer the long-term view. I make an investment and sit on it for years. I rarely trade except in anticipation of long term cycle changes. So I’m basically set now til 2023-4 as you say.
But I’d add that using shorter cycles, days/weeks, is a good way of building and exiting positions. Why buy/sell at tops and bottoms if there’s a chance of identifying them? And for those people who are deft at trading, and understand the market best from a shorter-term perspective, there’s much more money to be made by going in and out, trading around each IC for ex. Cycles are invaluable for that approach imo.
Btw, looks like we’re moving out of your wedge. Well done.
Agree with all of that CT. I’m sure we’ll break out of the wedge soon. We need a few more Dollars to be sure, and a weekly close above $1295 would be good (preferably above $1300).
You must be a young whipper-snapper to be able to wait until 2032 for that cold beer on a beach. Wonder where the term “whipper-snapper” came from? Wonder who put a cold beer and a beach together?
Oh, wait, I answered my own question: In the 17th century (London, Paris and other large cities) one could see young idle men who liked to think they were important while in reality they were unambitious pretentious louts whose only way of drawing attention to themselves was to constantly crack and snap a short whip which they carried.
Hence they were called “whipper-snappers”. The label was adopted by visitors from other countries and began to be used in America in the late 1700’s.
BTW, your charts are cool beans, man.
Love the history lesson – that’s one thing I’ve learned today at least 🙂 I stopped thinking of myself as a ‘whipper-snapper’ a while back. I’m 49, so the top in the late 2020’s might allow me to retire a few years early. I love meteorology, but travelling (whilst I’m still fit enough) is what I really want to do.
Ha! 49 qualifies you as a whipper snapper in my book.
I would recommend traveling in an RV if you are not hooked on high-cost resorts, hotels, etc. And staying fit regardless is key to enjoying travel. I’m now 72, started full-time RVing 5 years ago. I cannot believe how much less capable I am compared to two years ago. Now spending more time at the fitness center to slow the inevitable decline. I do have good genes, though – my dad lived to 95, my mom to 86.
We’ve been all over North America – 48 states, five provinces – gone puffin watching on an island, whale watching in Alaska, sat on the edge of a pond and watched a moose cow feed for half-hour+ within 20 feet of her. Went hunting grizzly bears on foot, followed one up a creek with a guide and sat and watched him strip a salmon within 15 feet of the river bank we were on. Had a bull elk decide to feed on the grass in our campsite in Jasper National Park. Caught salmon in Vancouver Bay. Hiked mountain tops in Colorado and to the bottom of the Grand Canyon and back. 10 mile backpacked into Havasu Falls, Arizona with my son three years ago. (Back when I was fit, ya know?) Toured some fantastic museums.
Nothing beats traveling. We’ve also been to Europe, Australia and New Zealand in another life (when we were young and carefree.) A blend of hiking and traipsing about, and staying in some amazing aguratismos and hotels. Skied Zermatt with an unobstructed view of the Matterhorn. Heck, even skied north of the Arctic Circle in Finland, for that matter.
It’s been a hoot so far, and will keep going till I can’t. Highly recommend!!!
“you’ll be able to find me on a tropical beach with a nice cold beer in my hand after that.: Heck I’m already there! I’m just holding on for the gold and silver horses to finish the race…
Sounds like you’ve had a blast Silverboom. Life’s for living, and I want to see as much as I can, while I can, like you. The US and Canada are on my list, along with New Zealand, Australia and SE Asia. I’ve travelled pretty extensively in Europe (Norway, France, Spain, Portugal, Greece, Cyprus, Italy, Malta, The Canary Islands, Croatia, Poland, as well as Kenya, Rwanda and Ethiopia). Money doesn’t make you happy, but it certainly helps to give you (and your loved ones) more options.
NS, you are a good guy and well intentioned…I just don’t believe in a 1+1 always equals 2 in cycles analyses…if it was that easy then everybody’s rich. It’s very easy to use a couple data points, slap a sine on it and claim it’s the yellow brick road. I know because I’ve been guilty of it myself….it’s neat chart flair but not sure of much more. This is the 16yr year extrapolated out in the BGMI…I’d say the results are mixed but mostly useless from a trading perspective…but that’s just my opinion. GL
https://stockcharts.com/h-sc/ui?s=%40BGMI&p=M&st=1931-06-03&id=p37291691584&a=664160476&listNum=1