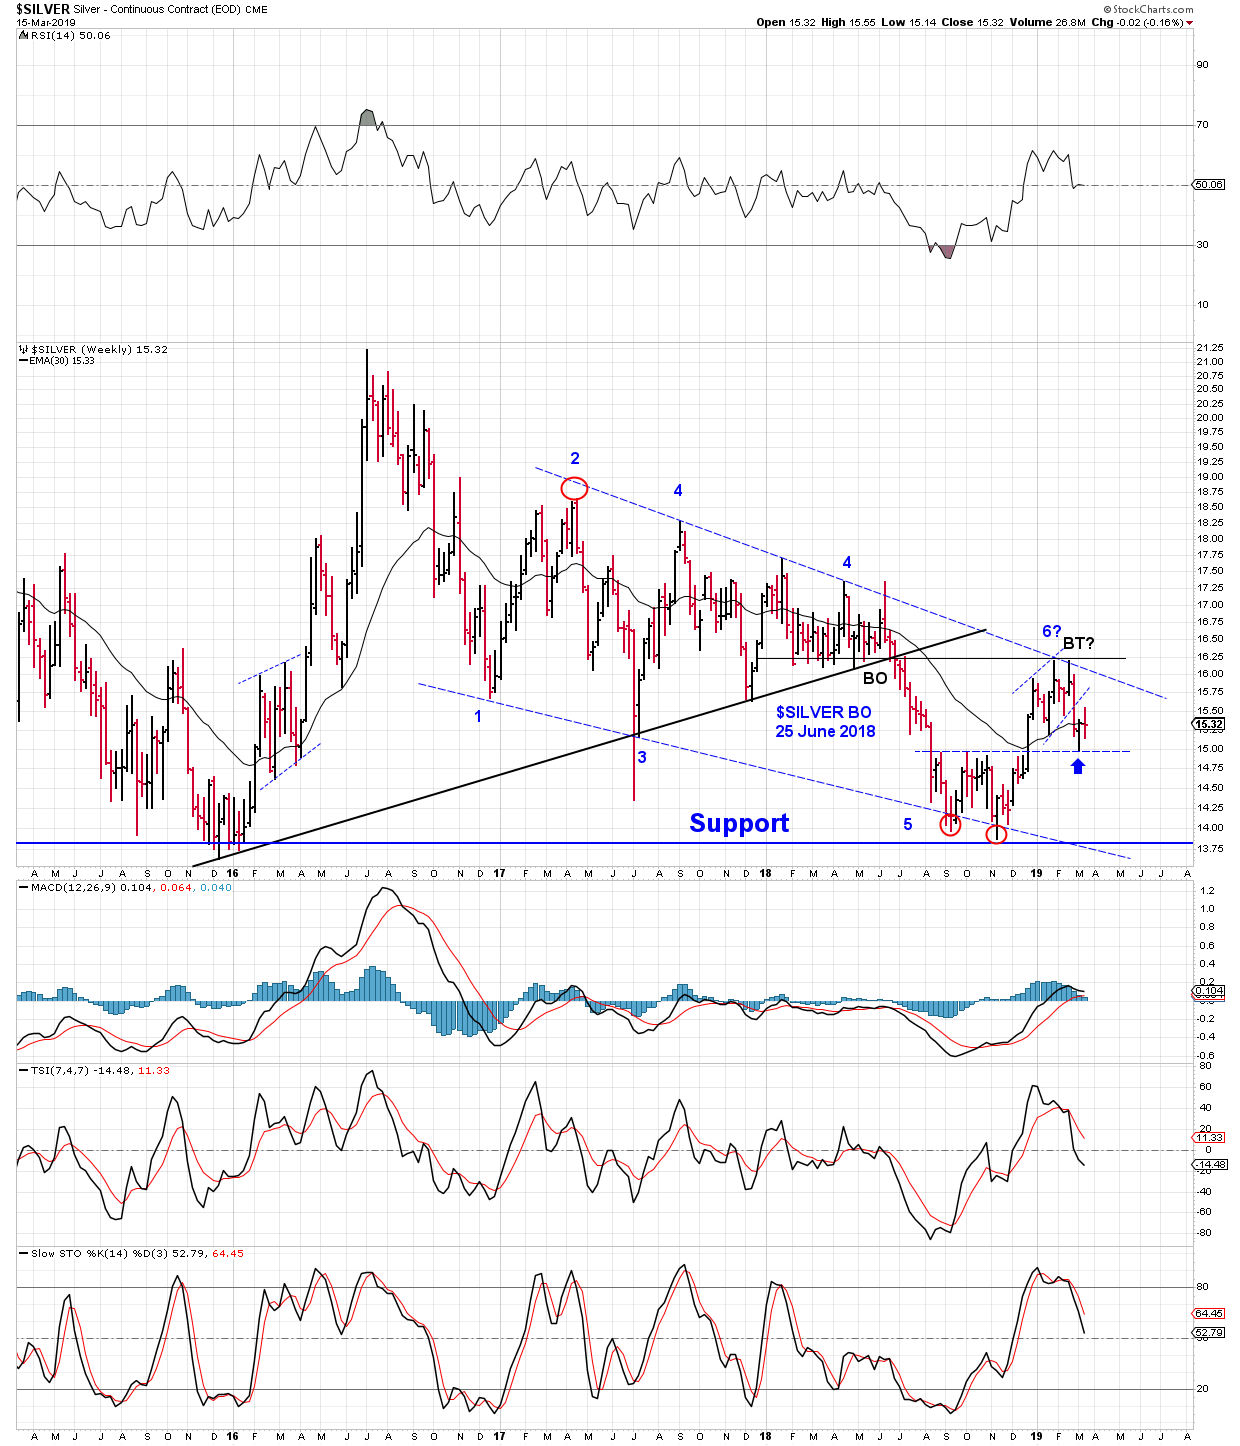
$Silver Weekly – bull or bear?
There are a few patterns to note on this weekly chart.
First, consider the black uptrend line off the December 2015 bottom that was broken to the down side 25 June last year. It appears $silver failed a retested of that break down level in January and again in February this year, forming a small double top.
Second, the rally off the 2015 bottom (the baby bull) decayed into a falling wedge pattern (dashed blue trend lines) Again, $Silver turned down in January and in February this year and is contained (so far) by the upper trend line of the falling wedge.
Third, $Silver found support at the horizontal dashed blue line marking the double bottom hump ($15.00) off the September and November bottoms. The support line is indicated on the chart with a blue arrow.
So, what’s the next move for $silver? $15.00 still has to hold. If it doesn’t there is a possible point 7 waiting on the falling blue wedge.
Good work Fox .
Charting Bob is like herding cats
🙂