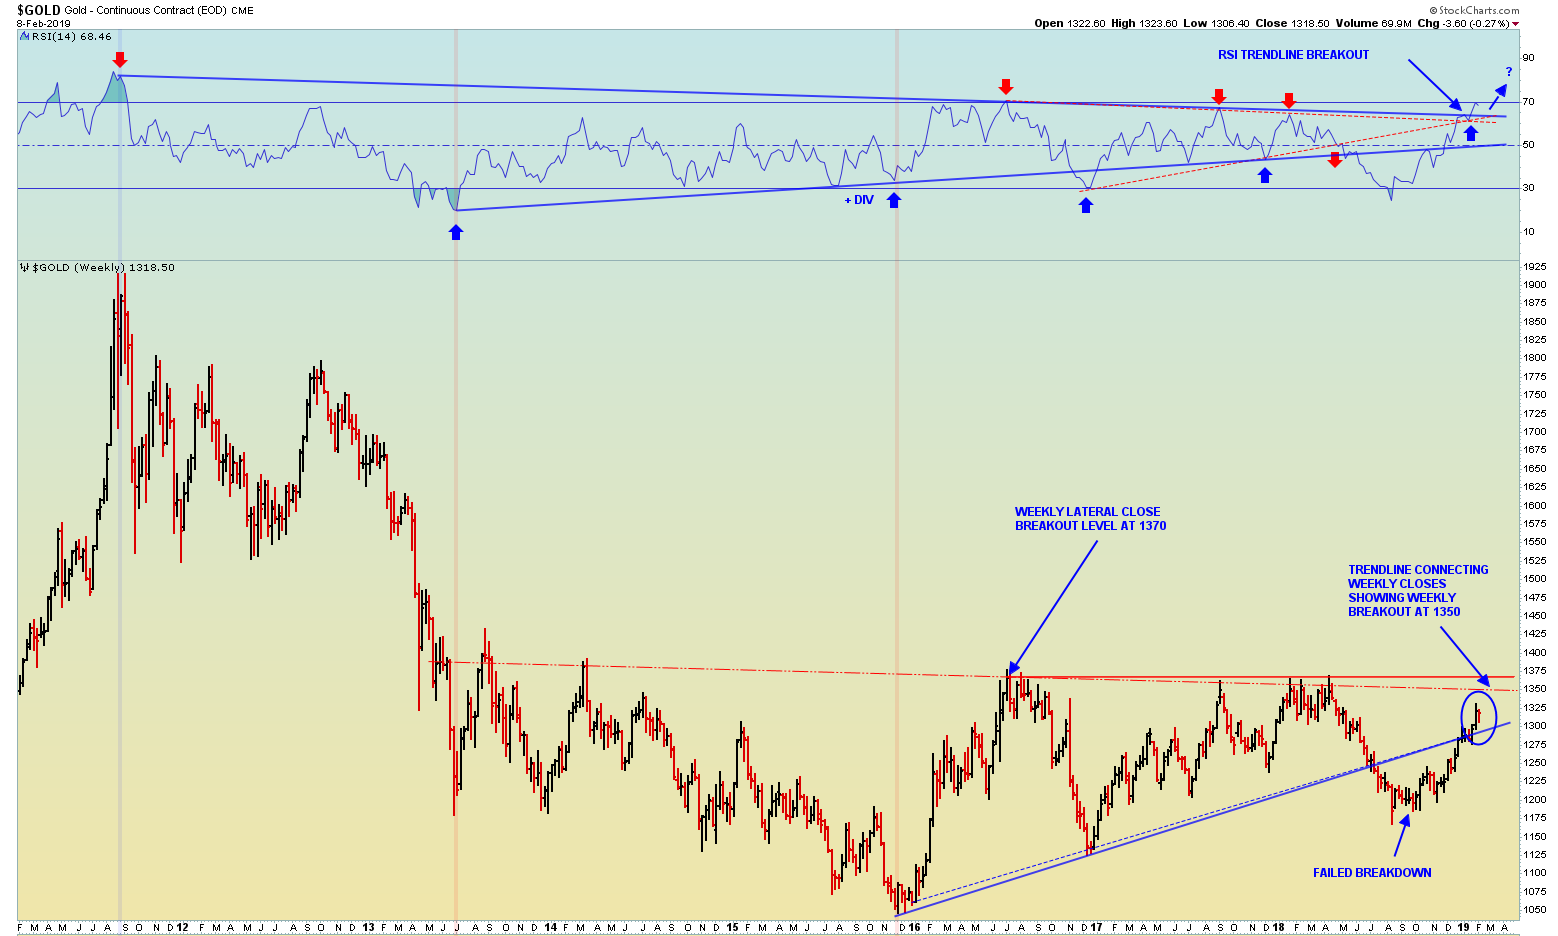
$GOLD Linear weekly
Nice charts there Fully- definitely a constructive look. I´m also looking at the RSI trendline that has broken to upside which has a bullish bias. US$1350 looks to be the weekly basing pattern breakout level with US$1370 being the lateral resistance level from 2016 weekly high. The ascending triangle that broke down is back inside the pattern after putting in a higher low. It´s another bullish clue as very often a strong move in opposite direction occurs after a failed move.