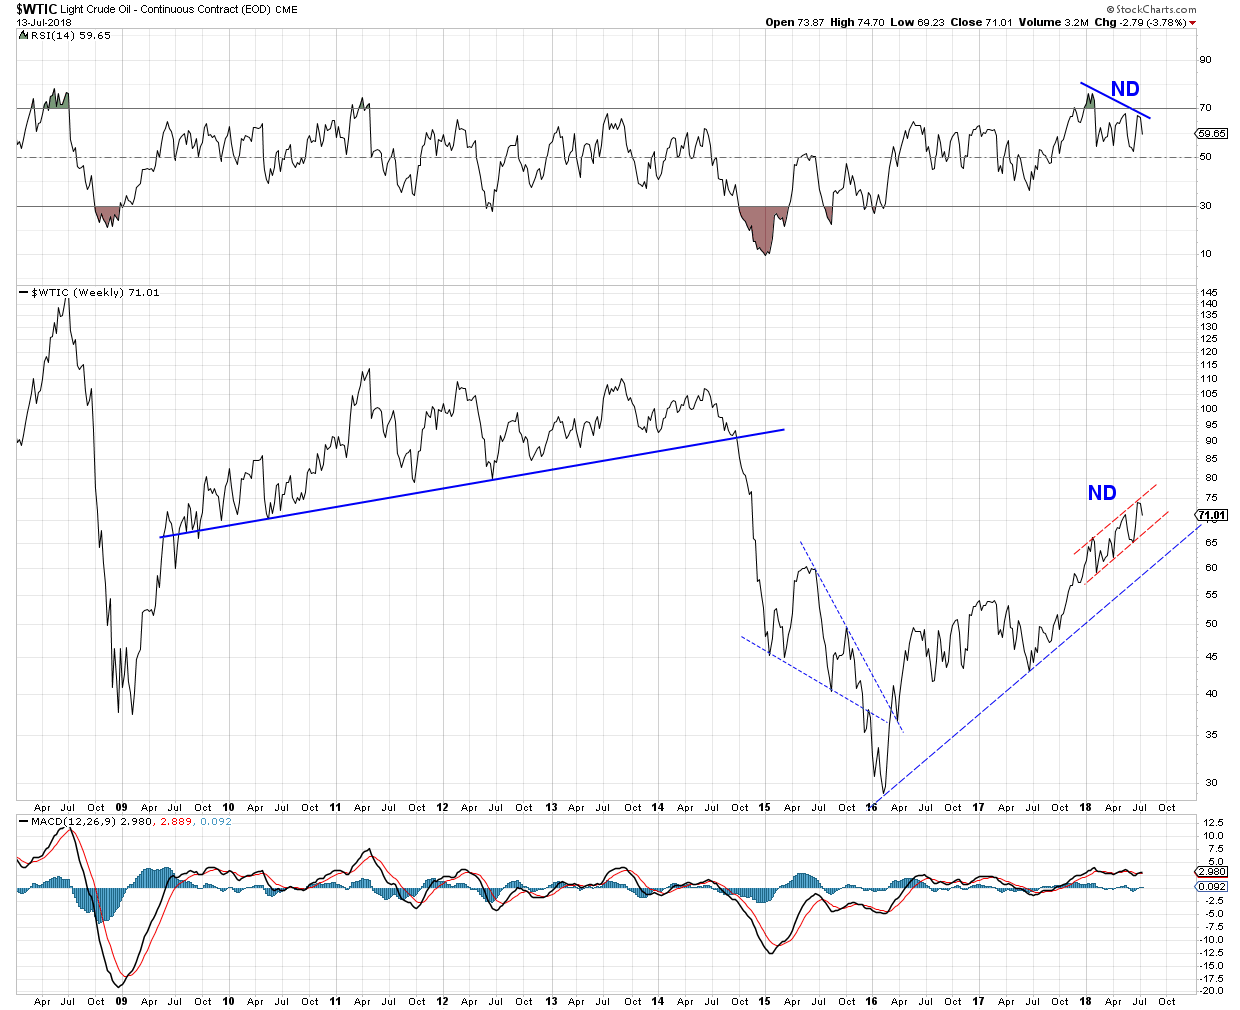
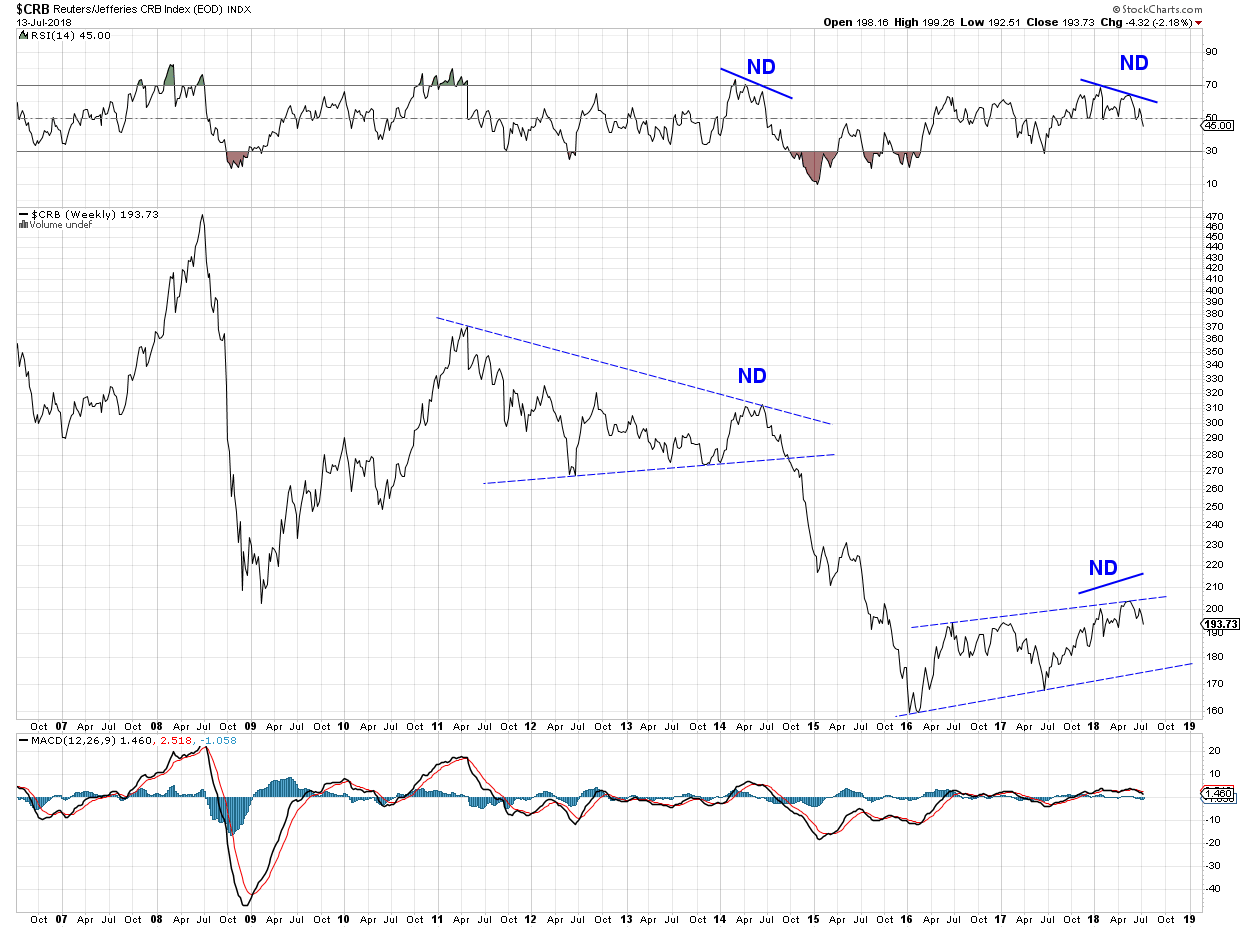
$CRB – Weekly $WTIC – Weekly
$CRB’s RSI negative divergence on the weekly chart suggest there is more to come for the recent down turn.
How much more? Could it reach the lower dashed blue trend line? The consolidation pattern unfolding since January 2016 looks like it could morph into a bear flag. But then, that would mean a serious deflation.
Is energy about to join the commodity downturn? $WTIC negative RSI is pointing in that direction. The lower trend line of the red channel is a possibility for now. The blue trend line is another.