UVXY Related Charts
Eagle, let me know whether these are of any use to you please because if not, I won’t post them again. (Too time consuming).
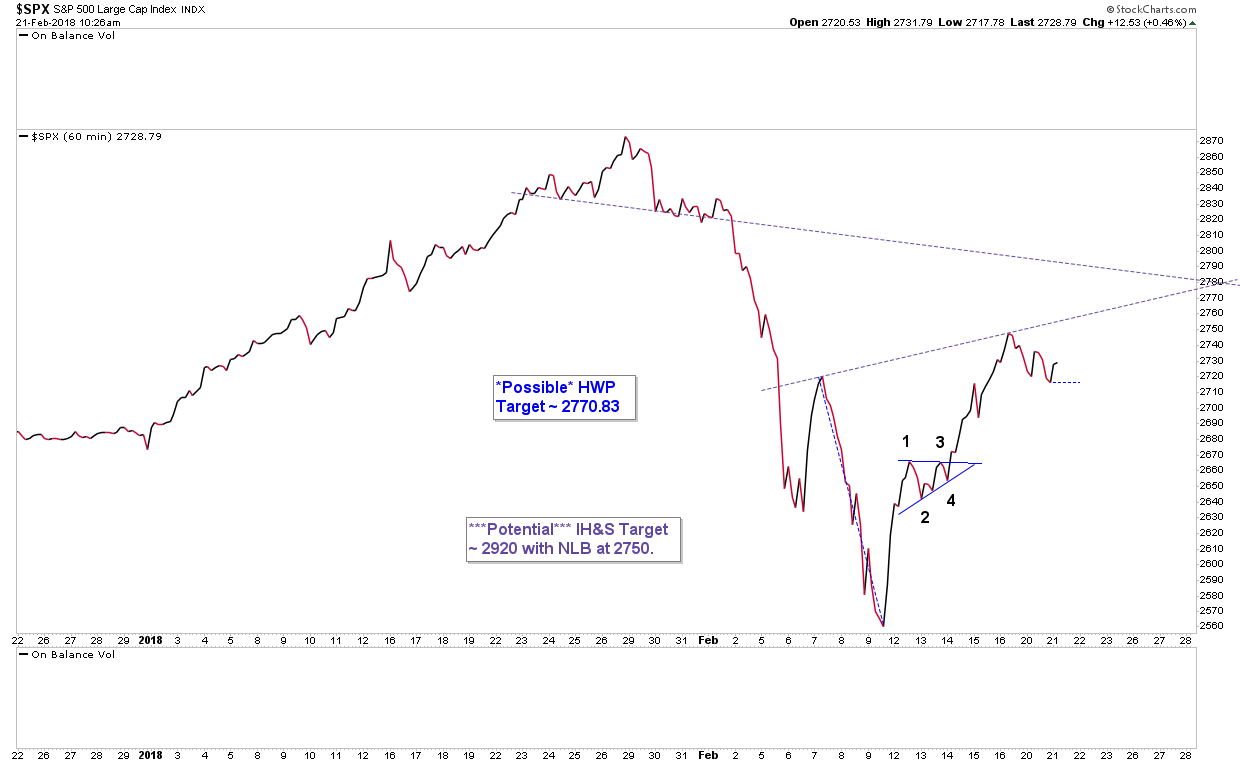
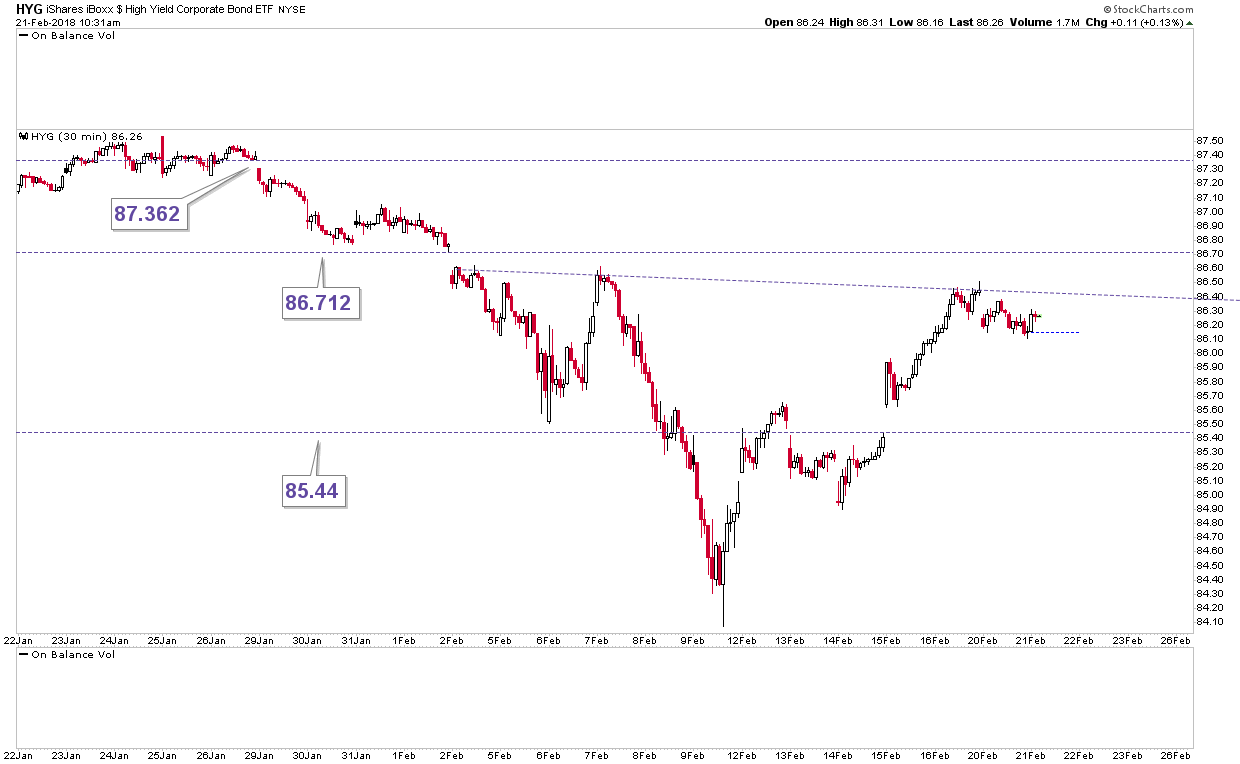
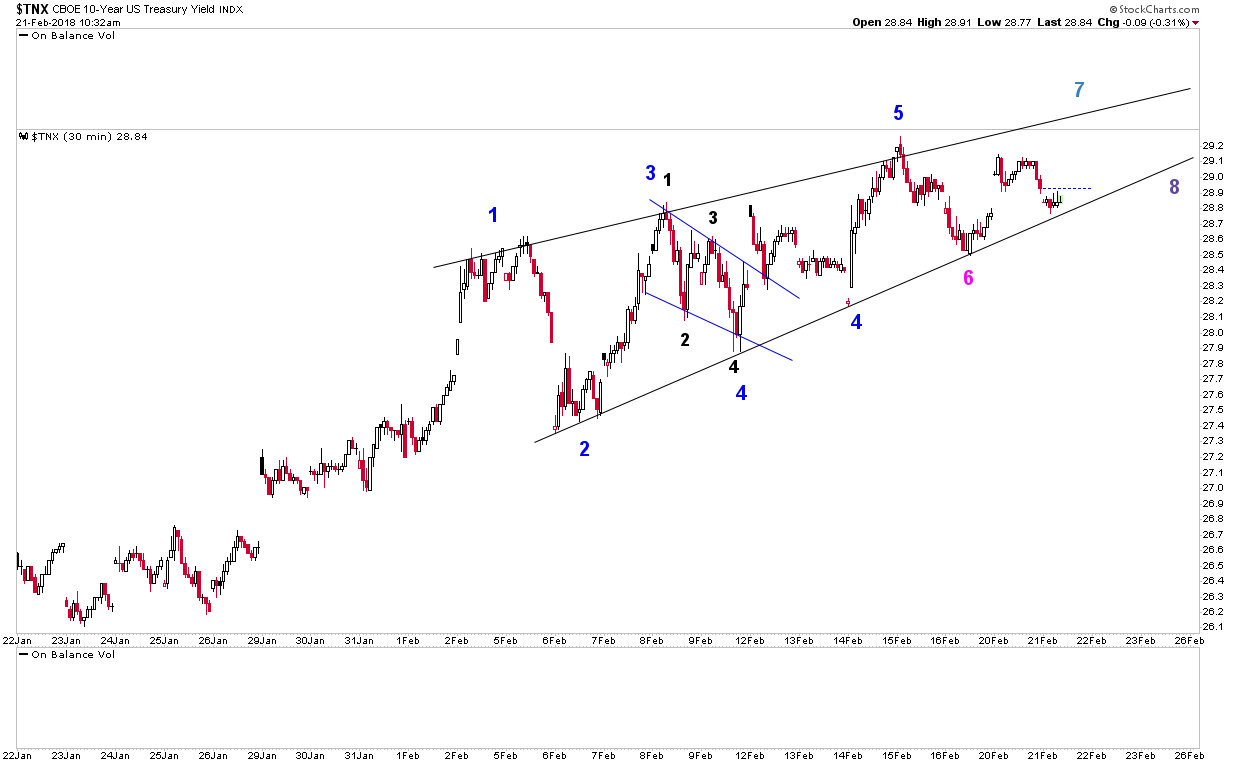
For me, I think $TNX is the key as to whether or not there is going to be a big fall in SM’s here. The 2 hour just looks like a bearish rising
wedge to me. However, I don’t think price will do anything other than backtest the neckline of the potential massive IH&S
(price targets still not calculated), before rallying up again. It’s that spike in $TNX, which I think will accompany SM’s
dropping quite significantly.


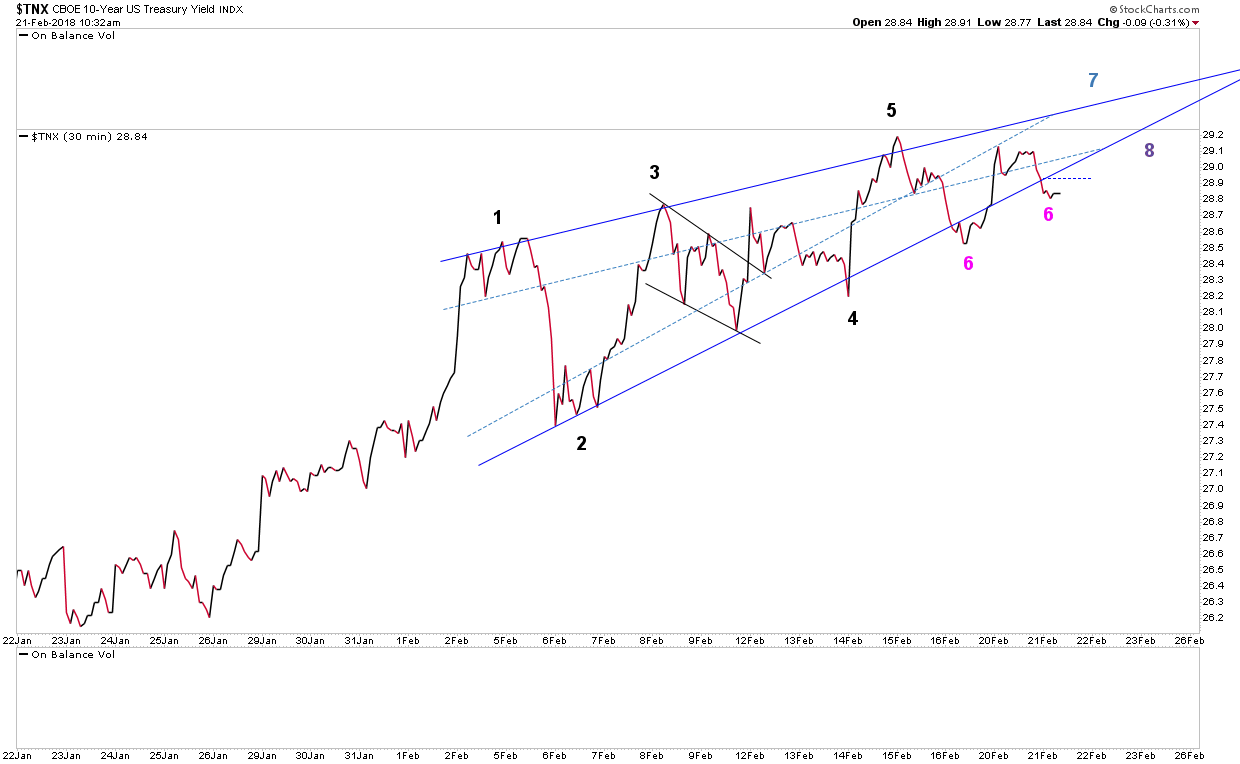
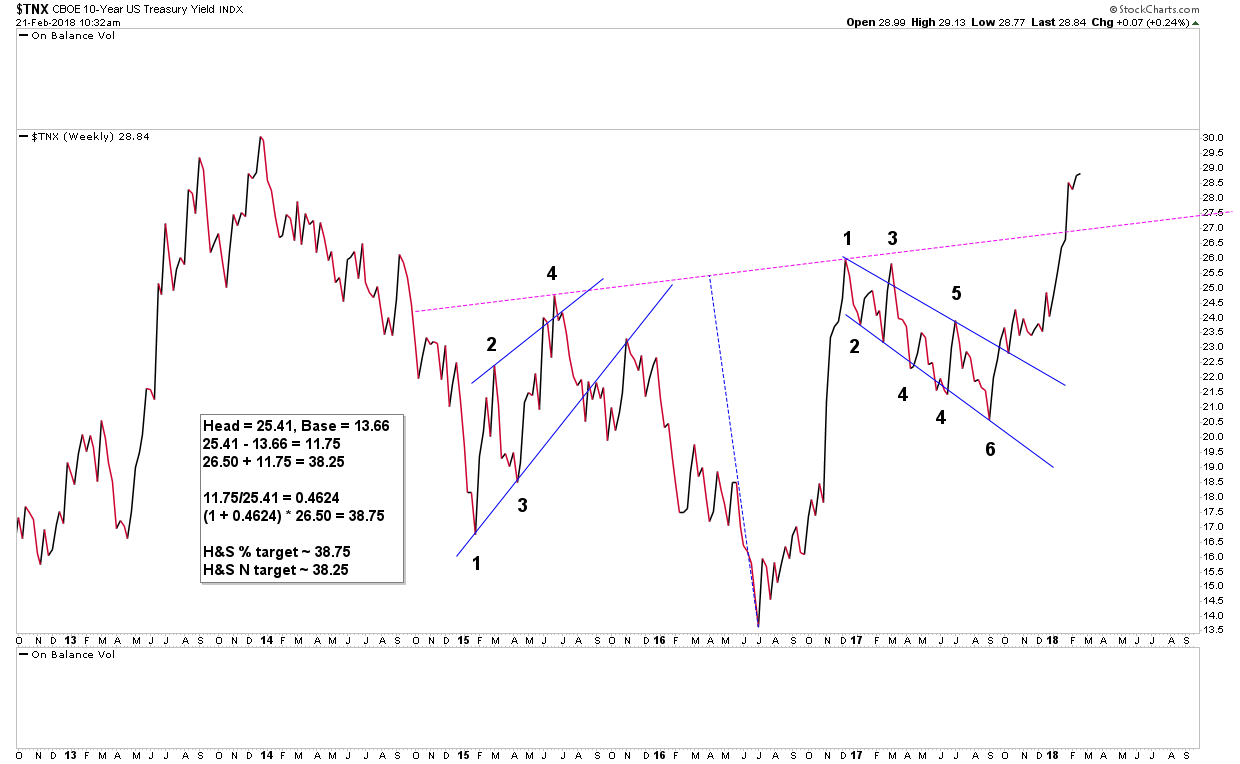
[Edit: As of now, 10 year looks done, i..e bearish, to me on these charts:

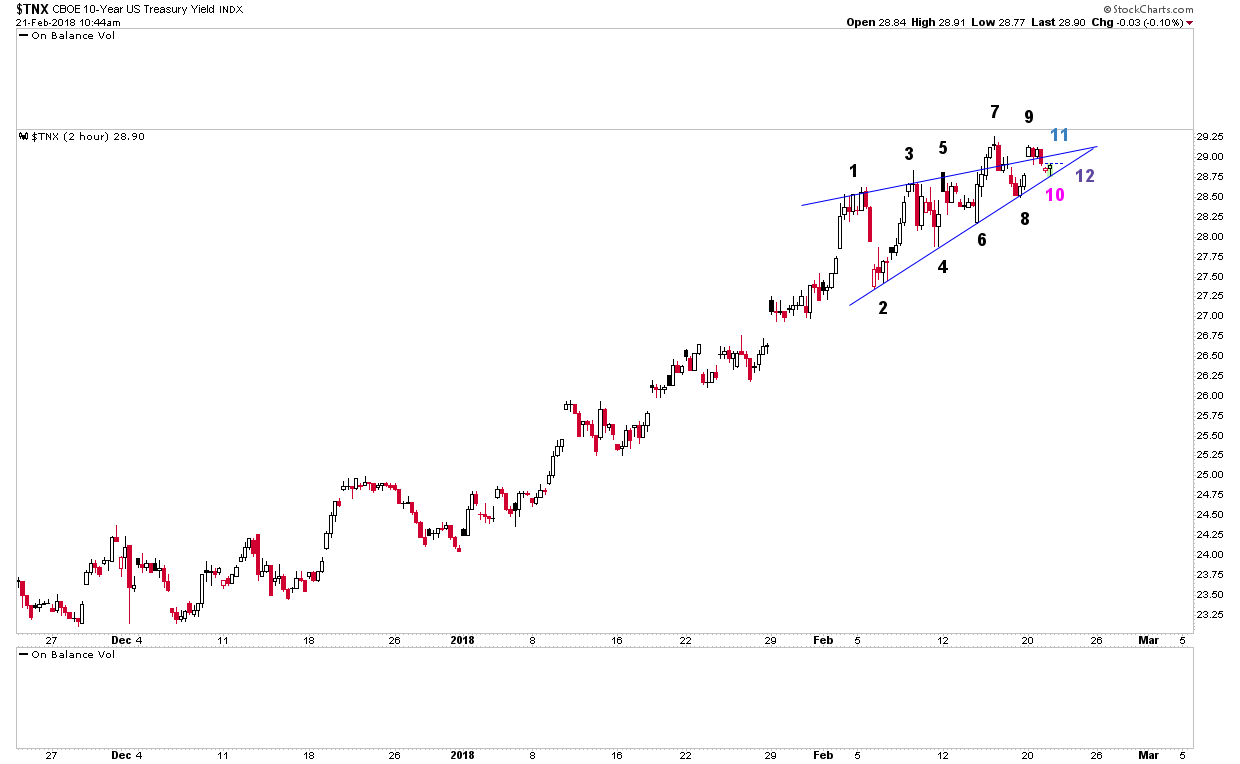
Last chart shows a resolution is, I think, imminent, so we’ll know soon enough.]
TNX 120 is of particular interest…thanks, realize the time and effort posting these things–good luck!
Thanks Eagle, you too.