Gold and Silver EW count

For RTV and all.
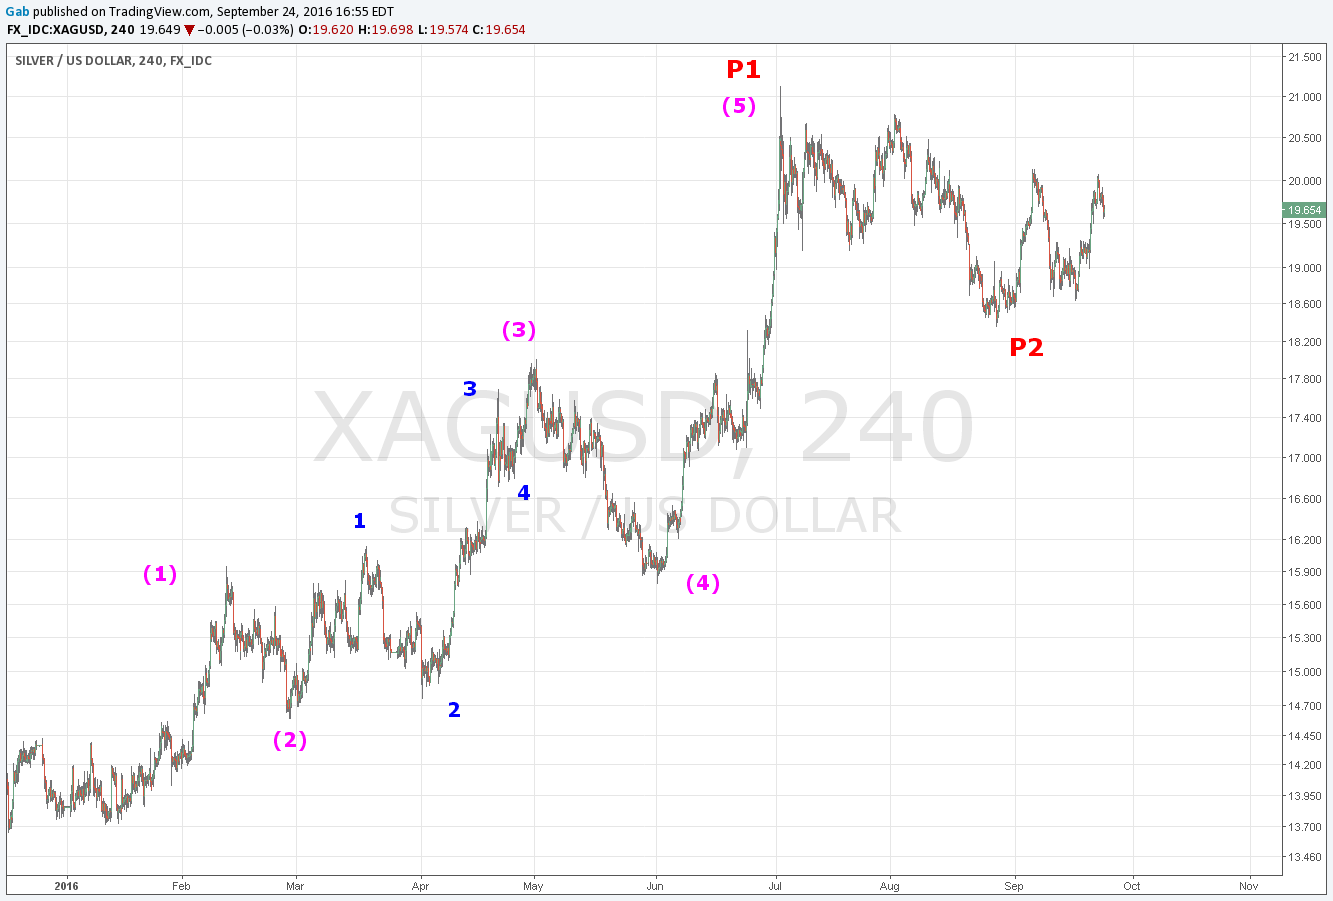
This is my EW count for gold and silver. The blow-off top in silver makes me think this correspond to a wave (5). Typical of commodities …
If you look at the chart of gold, you can see the struggle with the 2011 trendline and the lower trendline. Price is just been squeezed right at the corner.
We have coiling price action that is soon to face the moment of truth.
The price may go lower again to touch that support line, and if they do the point at which they
find support may be revealing. We may finally get the long anticipated breakout higher.
We are dealing with probabilities here and P2 can still go lower …
thx Gabe!
actually, for silver, i labeled what you refer to as wave (1) (2) followed by 1 & 2, as only wave (1), with a “running flat” a-b=c correction (unusual for a wave 1 i will certainly concede), which would lead to me labeling what you refer to as P1, as actually only wave (3), and that is because your wave (4) still crosses into wave (1) territory (although only slightly) – which would mean we are presently within a more complex wave (4) correction and have yet to complete wave P1…
but i don’t consider myself an EW expert so if you have some constructive comment on that i would appreciate it!
tx again!
RTV
No problem RTV. What i find more complex with EW is finding the right degree for waves …
This is why i prefer Long term trade and Swing trade base on overbought and oversold condition.
There is simply too many possibilities with EW for me. Better to apply numbers and letters after the fact …
couldn’t agree more – i study EW for it’s predictive properties, but find there are always alternative counts to consider. still – as you mentioned, we are dealing with probabilities here, not certainty. i like EW and will continue to study it – but will also employ chartology and other disciplines in conjunction.
Gabe, Nice charts and EW analysis. Question regarding P2. If Price were to break your Black support line out of the Dec 2015 low and find support at say 1250 to 1280 range, would this still be a bullish retrace-ment or would a level this low break some key EW Fib level?
Seems that 1250 would only be a Fib 32% but was just hoping to get your perspective.
Surf-
Gabe can correct me if I’m wrong, but EW has strict rules that cannot be violated, and guidelines that can. Wave 2’s typically correct to 61.8% fib, but can go lower as long as it doesn’t trade below the start of wave 1.
Wave 4, the other correctve wave, typically retraces 38.2%,but can retrace more as long as it does not penetrate into wave 1 territory.
The principle of “alternation” also applies. That is, if wave 2 is a sharp correction, then wave 4 is complex, and vice versa.
Agree with Gabe,it is good to incorporate chartology and other tools, as there are always alternative counts in play.
Thanks Surf. I appreciate your analysis with cycles.
From an EW perspective, the pullback of a wave 2 cannot retrace more than 100% of Wave 1.
So it will be invalidate only if we reach the low of Dec. 2015 … :(.
Fib. pullback are: 1297 (23.6%), 1249 (38.2%), 1211 (50%), 1172 (61.8%). It is typical to have a 50%-61.8% for a wave 2.
Be careful here because we have strong support at 1300-1310 and I may be wrong in the degree of the actual wave count.
Also, my count is Bullish. From a Bearish perspective, they assume the December low was a wave A of a big A-B-C correction.
My wave P1 can be a simple wave a. So we can make a another leg down for wave b and a final leg up for wave c to end the big wave B before the final leg down to the big wave C … OK nevermind. I am bullish :).
Gabe, Thanks. I understand the A,B,C scenario and possibility but was wondering what the Fib rules would be to distinguish between the July high being a Wave 1 Bull Market start vs Wave A of a corrective ABC move leading to a new Bear low.
For example, Avi has mentioned in on of his posts that he wants to see GDX move no lower than 20 or 19, I believe. I would assume that below 19 something on GDX is bearish as that open the possibility of an ABC.
If the 61.8% Fib retrace level is 19.82 then below that level would be bearish. Does this match your view?
Surf, I agree that a pullback below 19.82 (61.8%) will be very bearish for GDX and that we can trace a line in the sand at 19.
http://s15.postimg.org/ufya3aly3/GDX_092316.png
Thanks Gabe. 😉